
When businesses, governments and other policy makers prepare to make decisions, they often look at data to find trends. In this activity, we will use data and a graphing calculator, Desmos, or Geogebra to find an equation that best fits the data points.
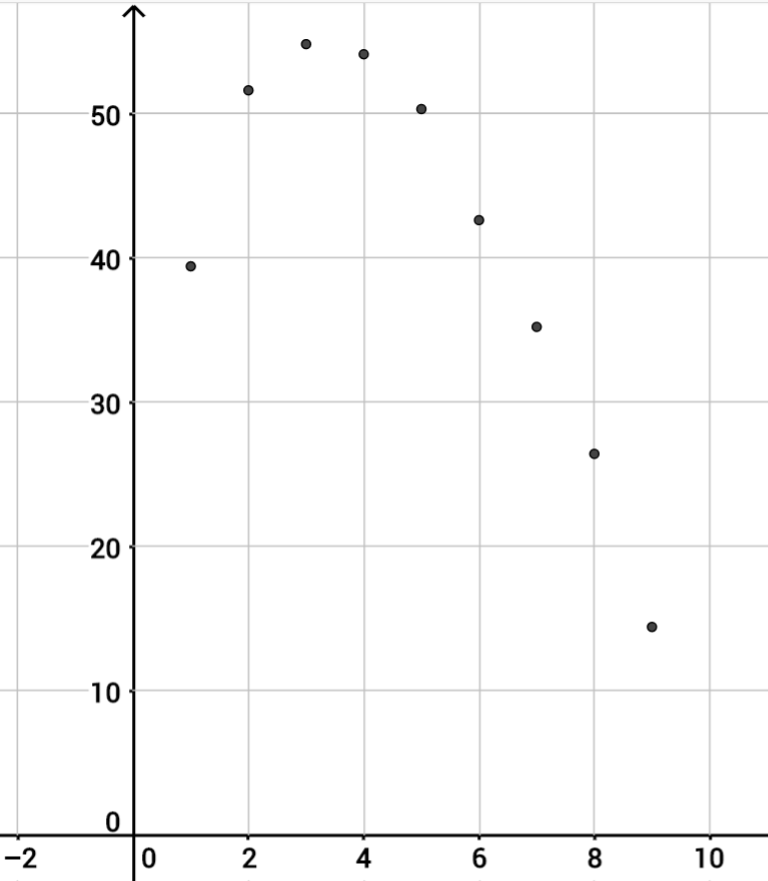
Statista has Global Apple iPod sales (in million units). Plot the data in a table in Desmos, a spreadsheet in Geogebra, or on your graphing calculator (click the links for instructions). When you enter your data, let the first year have the value x = 1 not x = 2007.
When you find a regression model for your data, an R2 value that is close to 1 shows a strong correlation between your data and your regression model (line, or curve). You can make projections about iPod sales using the regression equation.
- Why did iPod sales peak in 2009 and then start falling?
- What is your regression equation?
- Based on your model, when do you predict iPods will no longer be sold?
- Is your answer to question 3 likely or is it possible that there will always be a market for iPods? Explain.
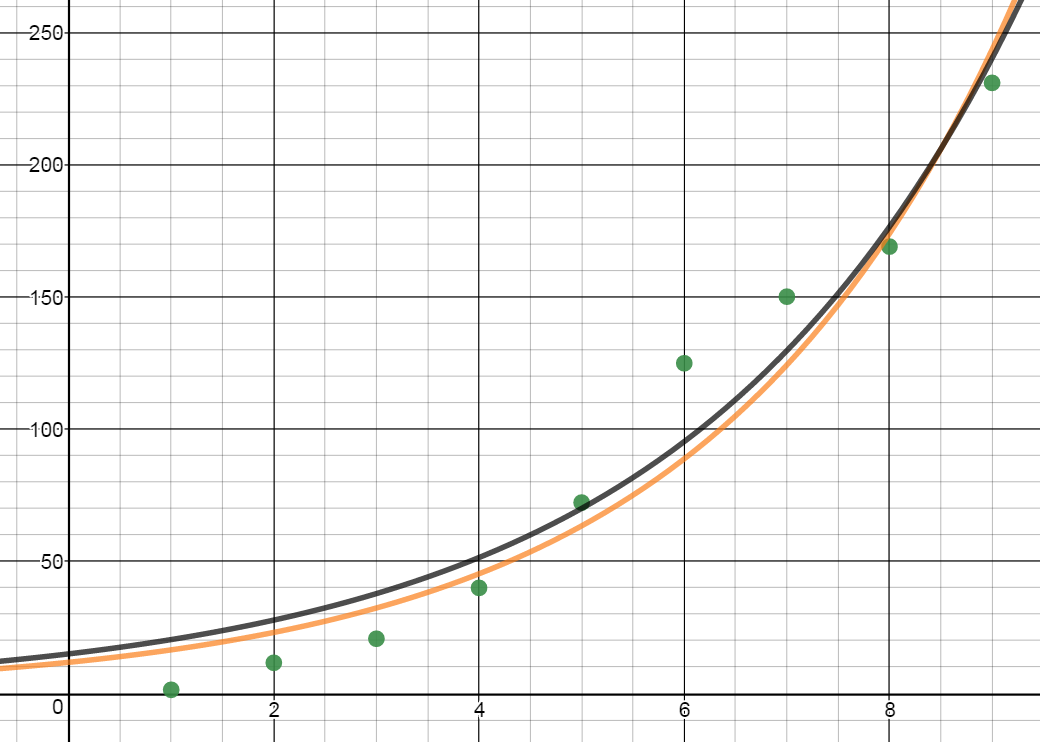
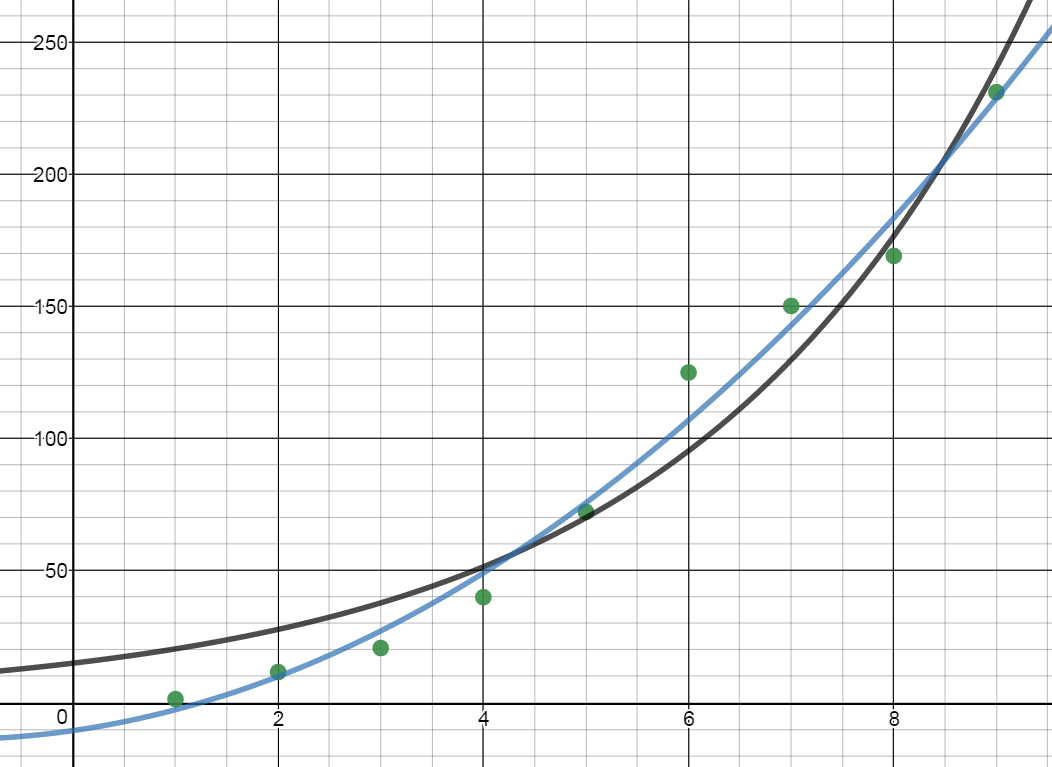
Statista also lists Unit sales of the Apple iPhone worldwide (in millions). Plot the data in a table in Desmos, a spreadsheet in Geogebra, or on your graphing calculator (click the links for instructions). This data appears to more closely resemble an exponential growth model of the form y=abx.
- What is your model?
- Based on your model, how many iPhones do you predict will be sold in 2018?
- What about 2019?
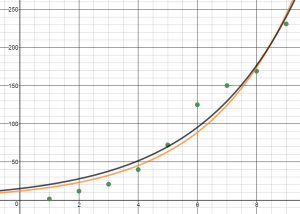
- Is there a better model for this data than exponential growth?
- If so, what is it and what is the regression equation?
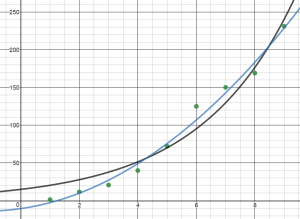
- How does that affect your predictions for sales for the next two years?
Chapter 3 Project
Could Nebraska Rely Exclusively on Wind Energy in Your Lifetime?

Leave A Comment