
- Go to Desmos.com and choose Start Graphing.
- In the upper left, choose Add Item > table.
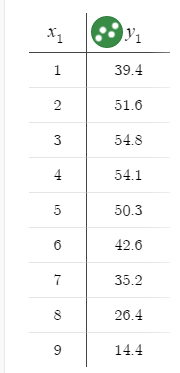
- Type your data in the table.
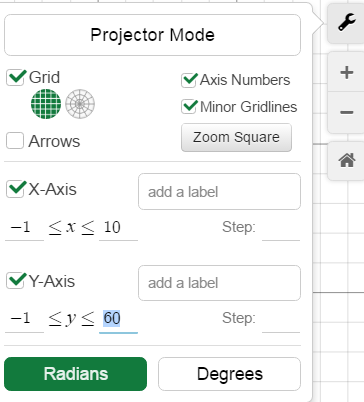
- Click on the wrench in the upper right to change the graph settings.
- Modify your x, and y values to reflect your data.
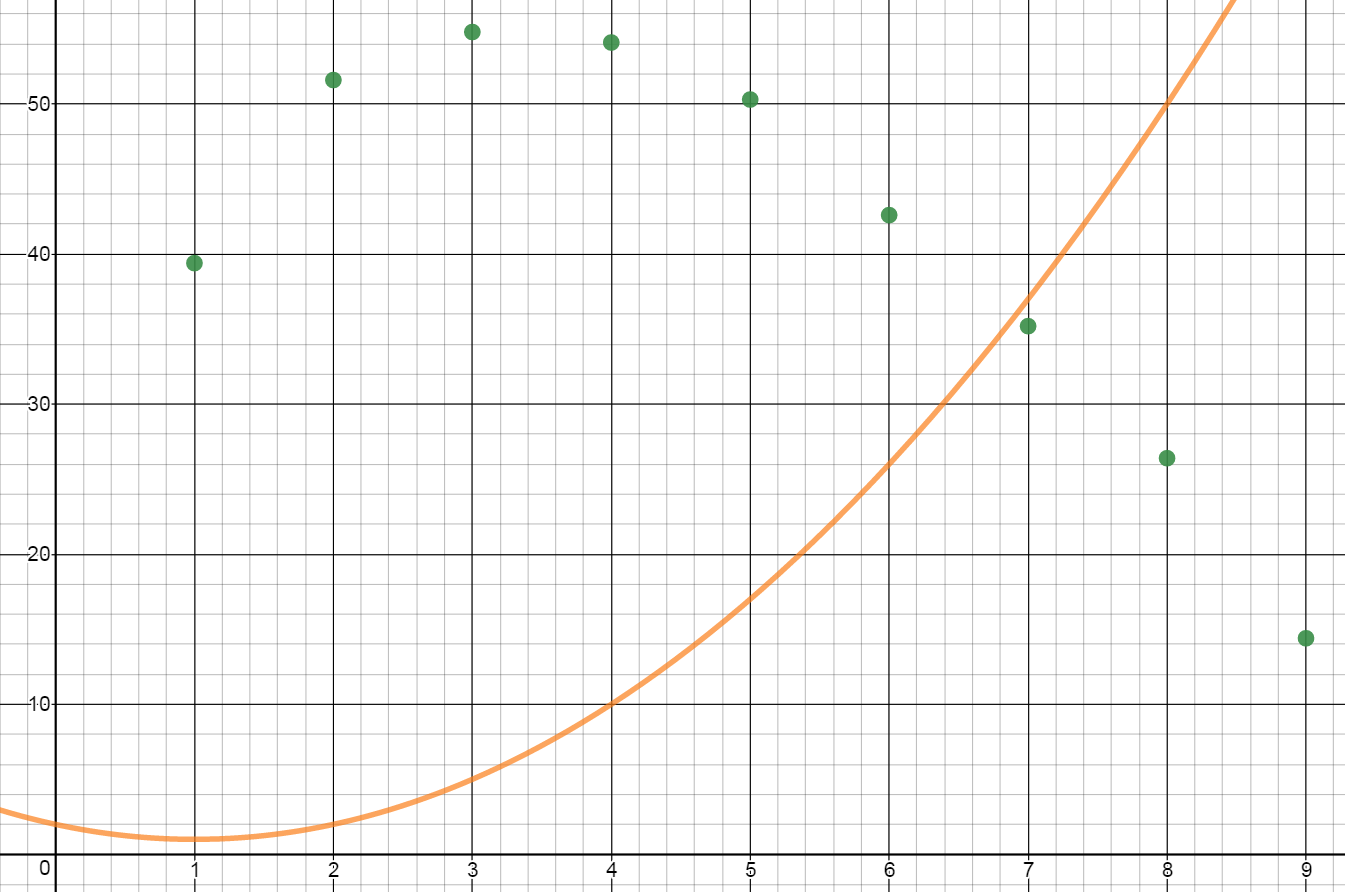
- Decide what type of equation the data represents. In the example above, the data appears to be quadratic.
- In the input area, type y=a(x-h)^2 + k and press Enter. Sliders will be added for a, h, and k.
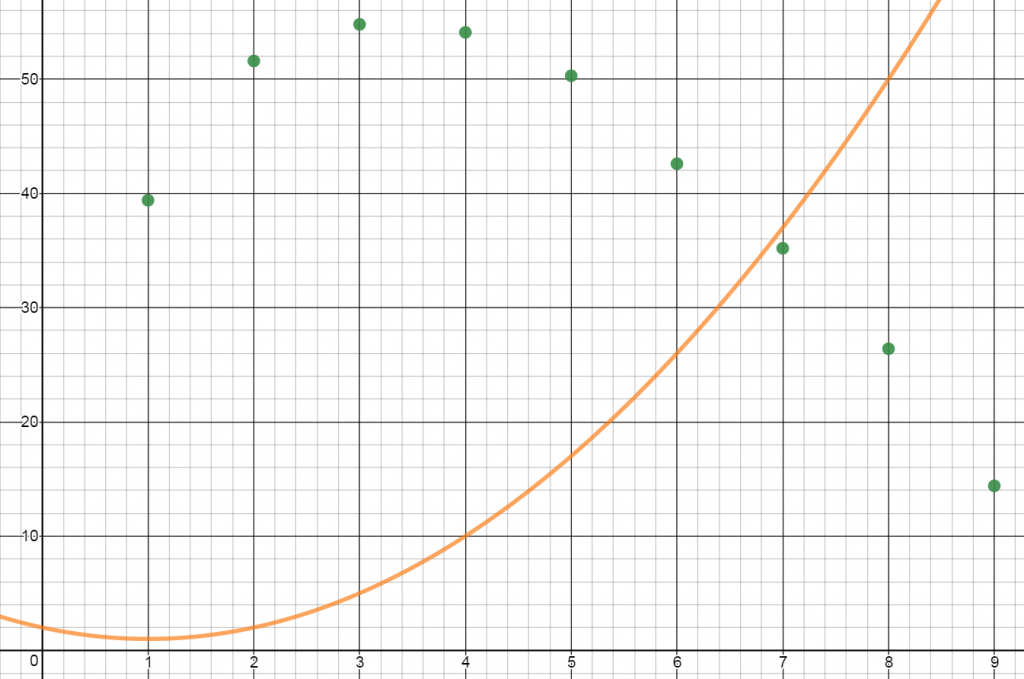
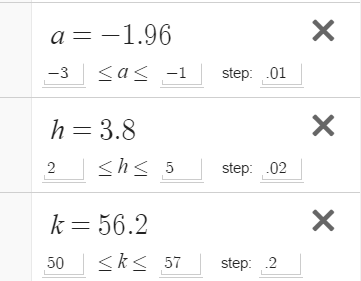
- Adjust the values of the sliders until the graph of the equation most closely fits your data points. You will likely need to change your slider settings. To do so, click on the gear icon to Edit List.
- The R-squared value is a statistical measure of how close the data are to a fitted regression line. The closer R2 is to 1, the better the curve matches the data. To have Desmos calculate your R2 value in a new input line type y1 ~ a(x1-h)^2+k. Desmos uses y1 to represent the y-value in a data table and x1 to represent the x-values in a table.
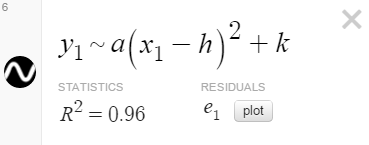
- Adjust your sliders until you get the highest possible value for R². Write down your equation of best fit.
- To have Desmos create an equation of best fit, in the input bar, add a new equation y1~bx1^2+cx1+d. Compare the equation Desmos generated to yours.

What about exponentials
Take logs of both sides and fit as linear
y1~ab^x1
or y1~mx1+b
The equation that you listed will get you the LINE of best fit. This page helps you find the CURVE of best fit. Apologies for the misconception.
omg you saved my life I looked for an hour
Thank you
What about if it’s not a curve?
y1~mx1+b Is the line of best fit if that’s what you are looking for
you put in y1~m 1/2 -bn1 –
you put in y1~m 1/2
Is it possible to do y=ax^2+bx+c?
Yes, use y1 ~ ax1^2 + bx1 + c
Yes just put a subscript 1 on each x and y variable. And a squiggle line instead of equals.
how do you do an eclipse (like an oval) of best fit?
My own created website free graphing calculator https://graph2d.com can draw any graph of mathematics function.