The article titled “Slope” described real-world situations in which the concept of slope is useful. “Graphing Slope” is the next step. Moving the concept to graph paper or a graphing application.
Once you have a firm grasp of what slope is you can use it to help write equations that can answer questions. First you must understand the difference between a dependent and an independent variable.
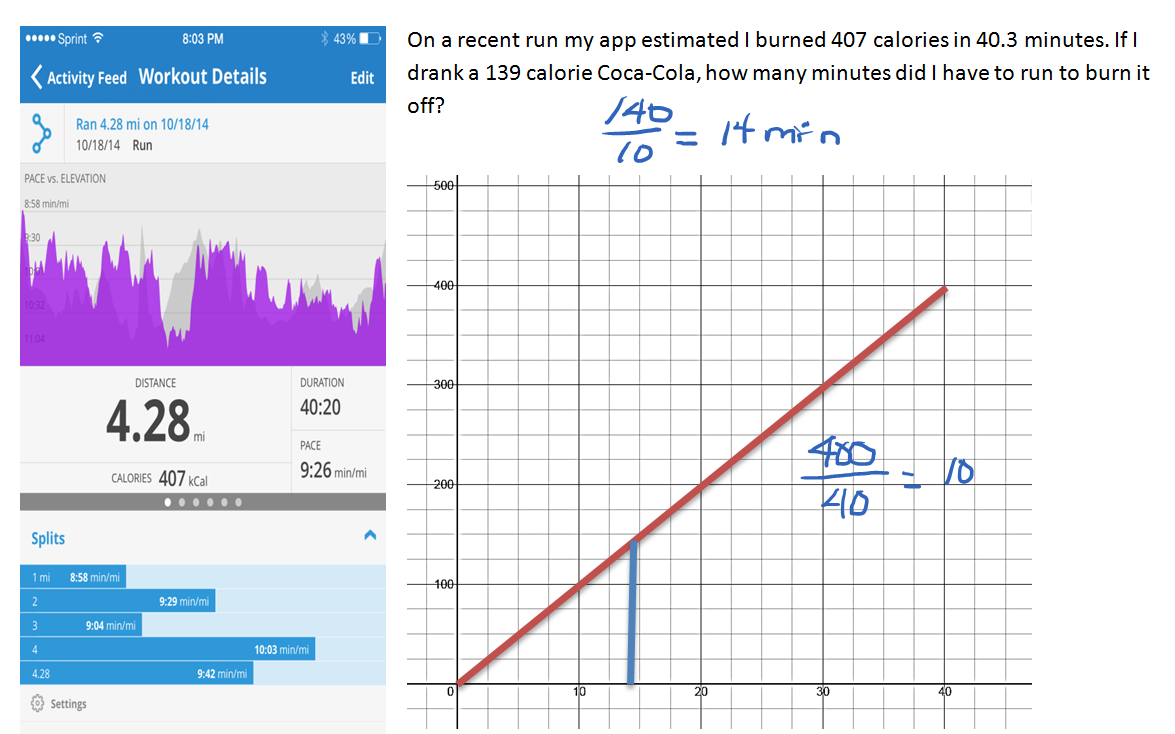
In this example, I had two things that varied: the number of calories I was burning and the time I was running. When I graph these variables, I ask myself did the time I ran depend on the number of calories I burned, or did the calories I burned depend on how long I ran?
Because the calories burned depend on how long I run, the calories go along the y-axis and the time is on the x-axis.
In this second example, the calf’s weight depends on how long he has been growing. The weight belongs on the y-axis and the age of the calf lies along the x-axis.
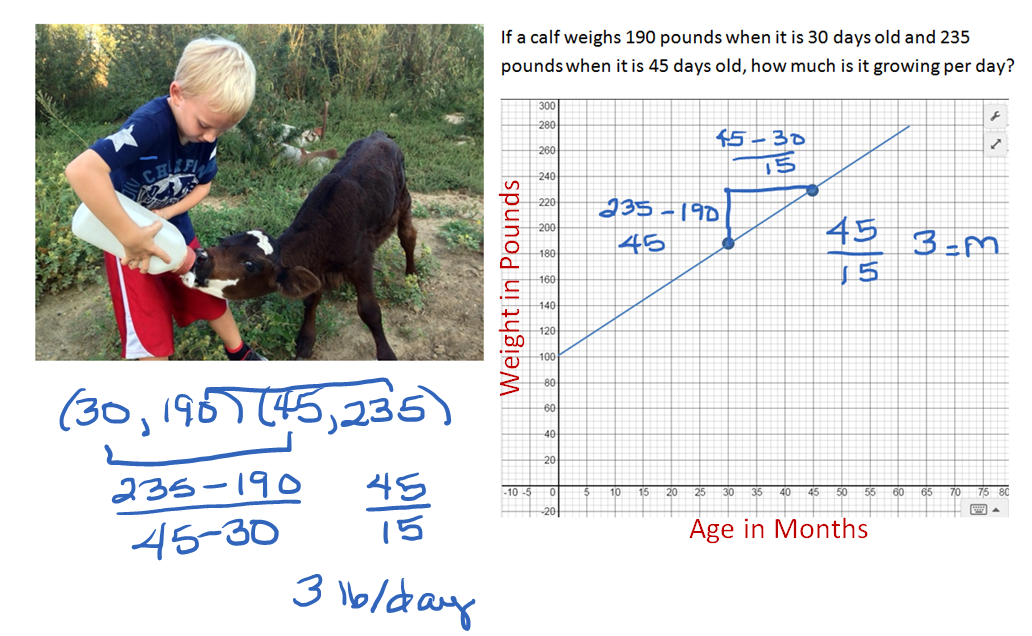
Let’s revisit this example and write the given information as ordered pairs. Since the age of the calf is the independent variable, it is the x value of the ordered pair and the weight or dependent variable is the y value. Our two ordered pairs become (30, 190) and (45, 235). The rate of change or slope for this problem is the change in y (weight) over the change in x (age). When we found our rise over our run, we took our second y minus our first one (235 – 190) and found our weight change to be 45 pounds. Our run was the change in age (45 – 30) 15 days. Dividing 45 pounds of weight gain by 15 days, we learned the calf gained three pounds per day.
We can write an equation describing the calf’s growth as follows:
y = 3x + 100
Where did the 100 come from and what does it stand for? If we look at the graph of the line, it crosses the y-axis when y is 100. That’s the y-intercept. When x = 0, when the calf was born, it weighed 100 pounds. The neat thing about having the equation is that we can predict how much the calf will weigh when he is 3 months old.
y = 3(90) + 100
y = 370 pounds
We can also predict when he will be 750 pounds which is when many calves are sold to a feed lot.
750 = 3x + 100
x = 217 days or a little over 7 months
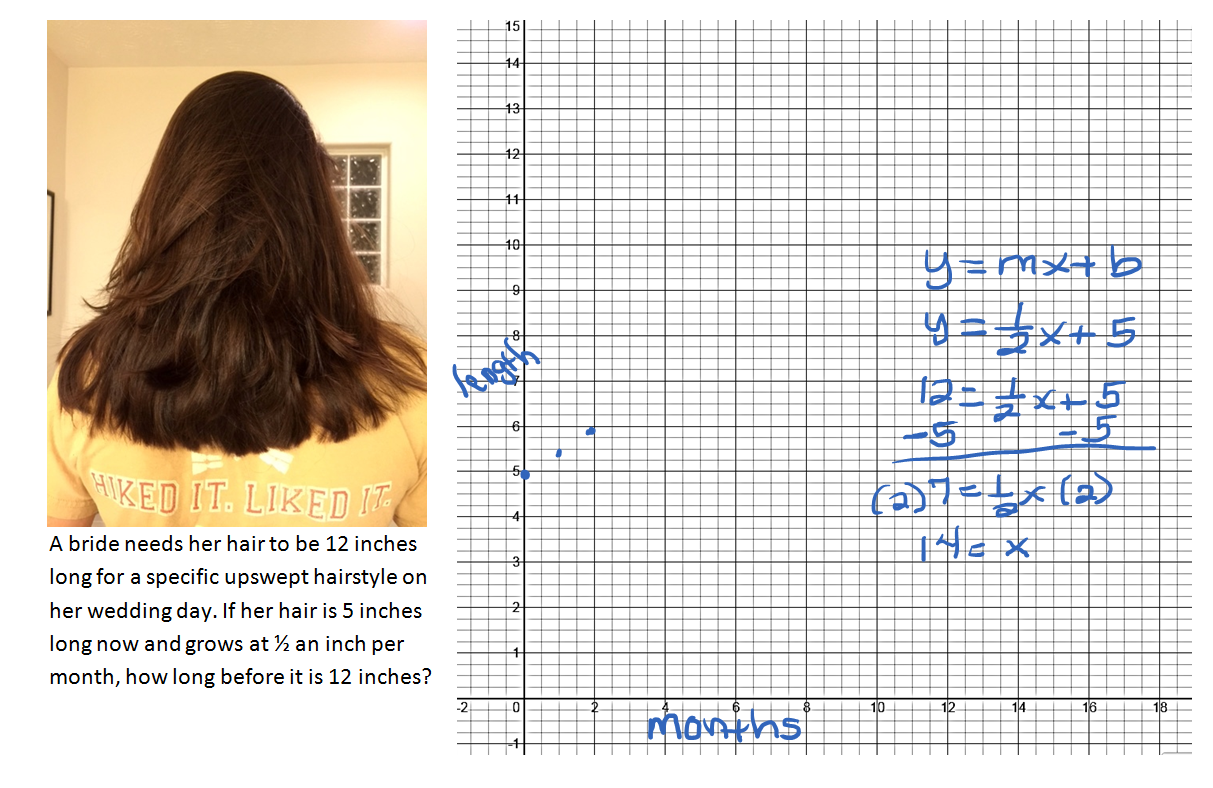
The length of the hair depends on how long she has been growing it so y corresponds to length and x corresponds to time in months. The rate of change or slope here is the ½ an inch per month. Let’s put the slope in the equation.
y = ½x + b
What is the y-intercept? If she starts growing her hair now, at time 0 months, how long is it?
y = ½x + 5
To find out how long it will take to grow the hair to 12 inches, substitute 12 in for y and solve for x.
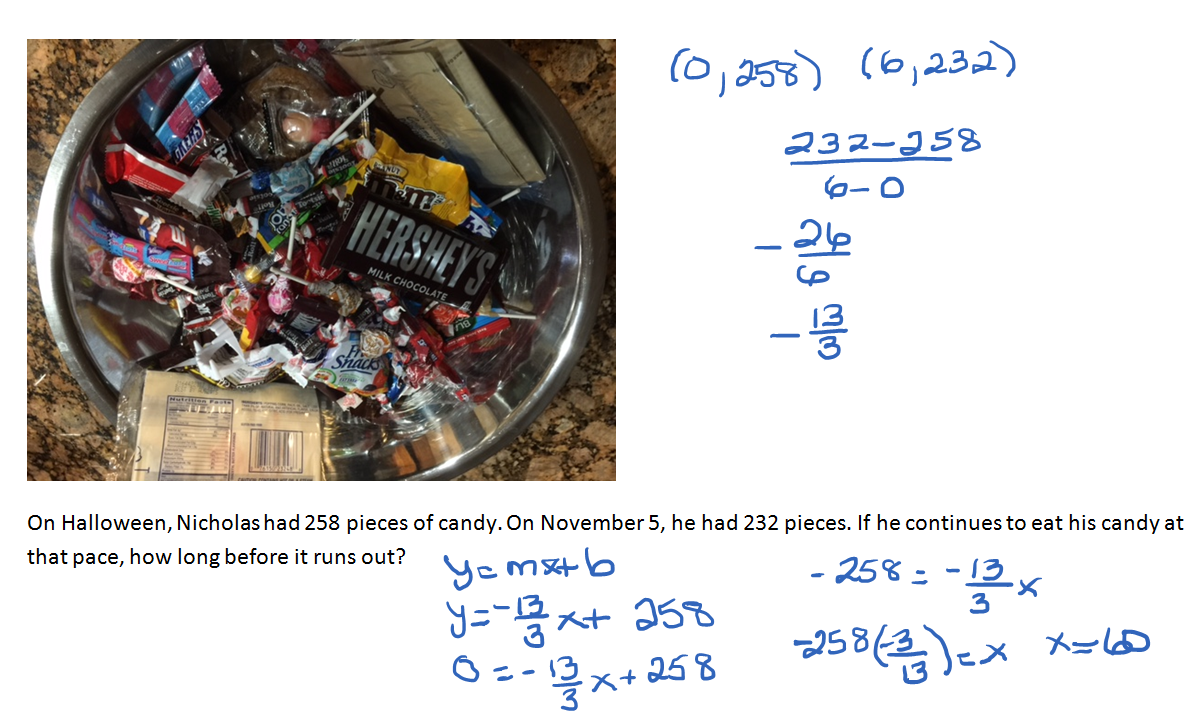
Again, a strategy is to write these out as ordered pairs. Halloween represents day 0. (0, 258) November 5th is six days of eating candy (6, 232). Calculate the slope. Write the equation in slope y-intercept form.
y = -13/3 x + 258
He will run out when there is no more candy left. That is the day when y = 0.
0 = -13/3 x + 258

Fill in the equation y = mx + b with the correct values for m and b.
y = 12x + 480
Substitute 2000 in for y and solve for x.
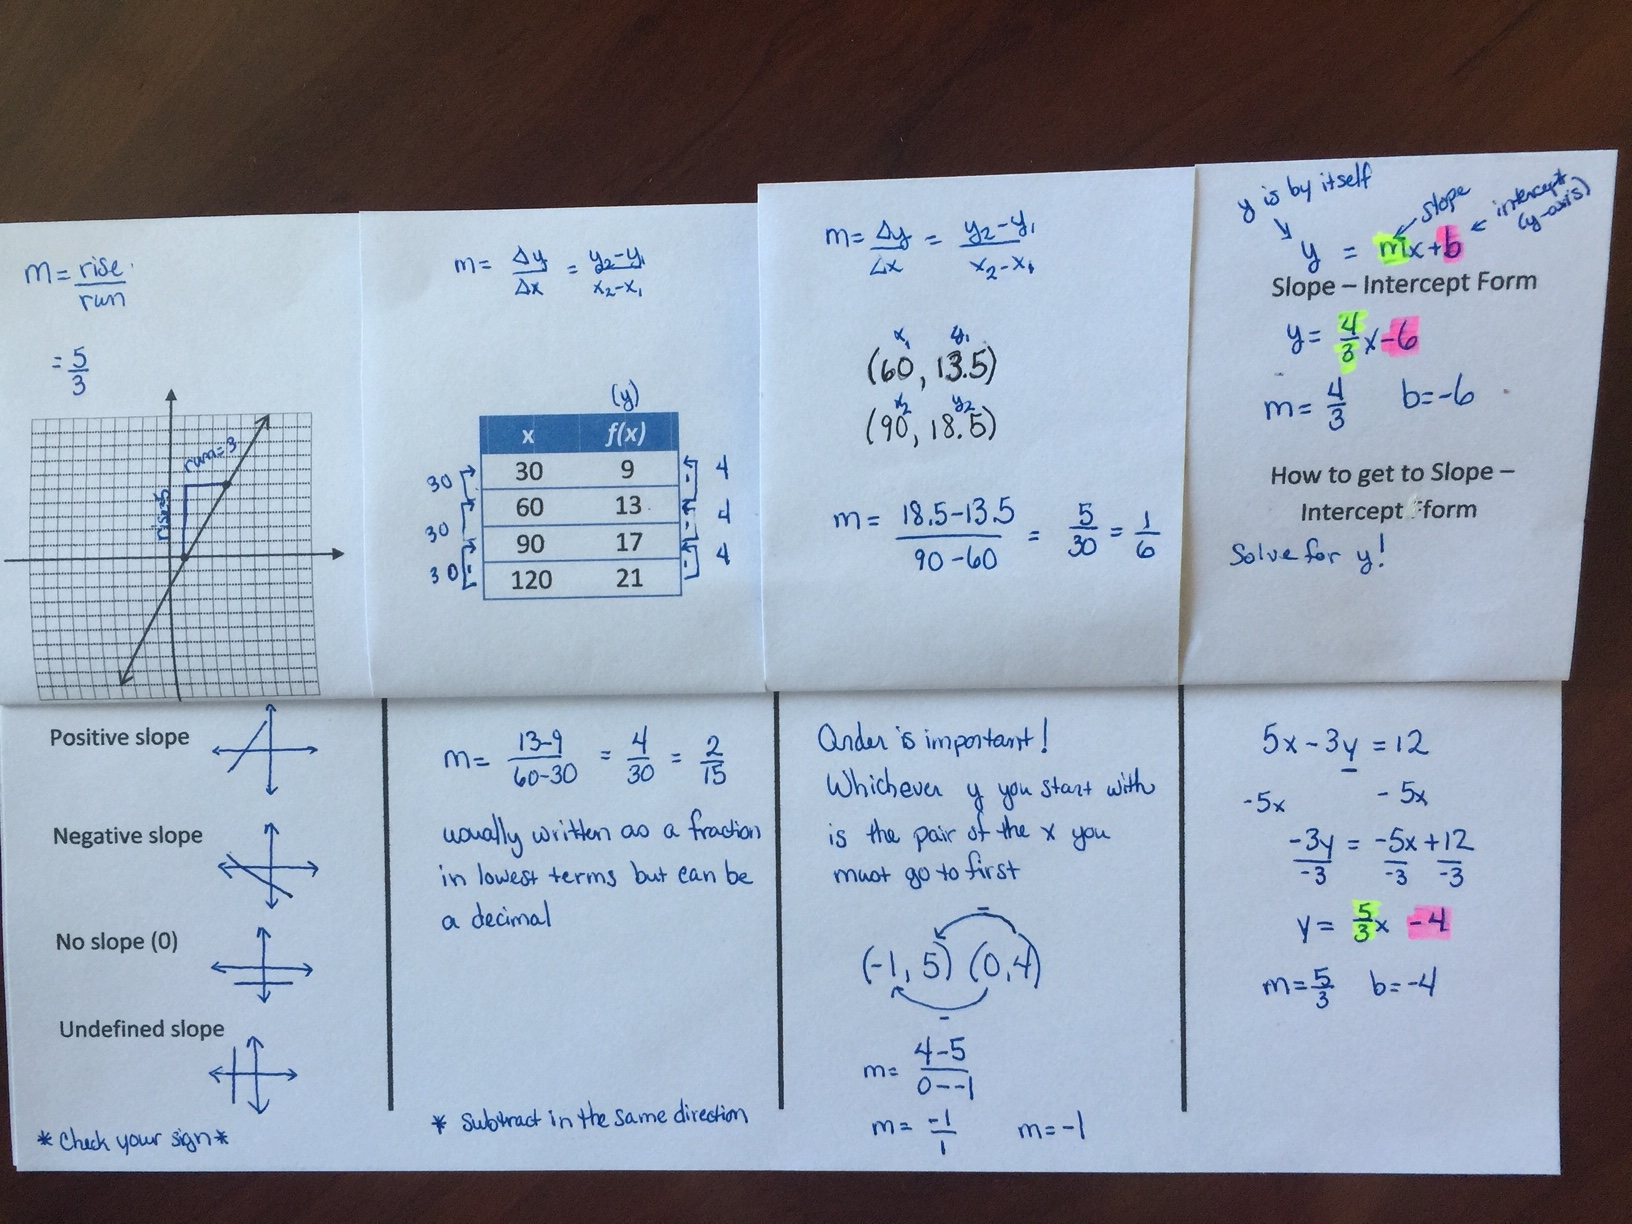
A slope foldable for note taking is available for download. Inspiration from ispeakmath.org.