
Exercise 1
Use toothpicks or draw figures to simulate the geometric figures shown below. Complete the tables.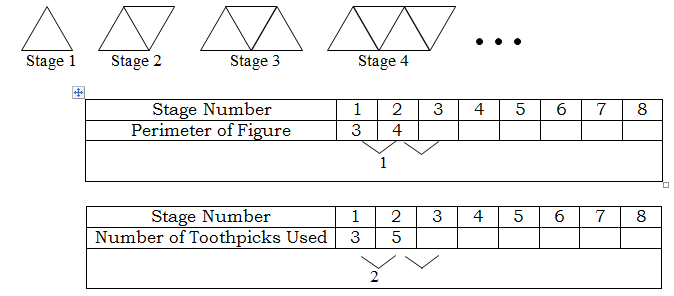
In the blank area below the data in the table, determine by how much the perimeter or number of toothpicks increase.
Write an equation for each of the tables.
What is the perimeter of the figure formed on Stage 100?
How many toothpicks will be used on Stage 100?
Explain how you know if a table can be modeled by a linear relationship.
Exercise 2
Find the first 12 terms for each of the following patterns. Find the differences for each pattern. Determine whether the pattern can be modeled by a linear function.
- 1, 4, 9, 16, …
- 114, 106, 98, 90, …
- 1, 3, 6, 10, …
Exercise 3
Fill out the table below based on the geometric pattern given. Then determine the differences.
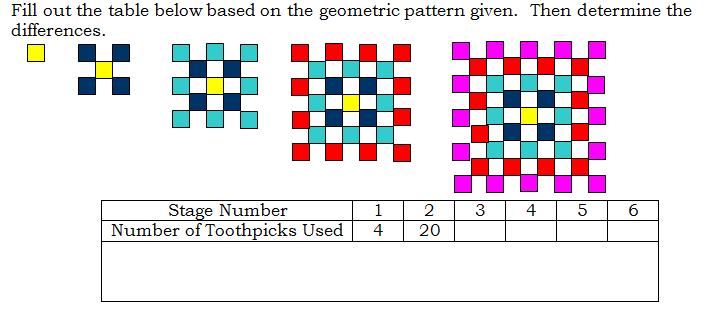
Can this pattern be modeled by a linear equation? Why or why not?
Find the second differences (the differences between the differences).
What type of model have you found this pattern to model?
Find the equation that models the above pattern.
How many toothpicks would be needed in stage 8?
Exercise 4
Examine the differences in the following function and determine what type of model it is.
| n | 1 | 2 | 3 | 4 | 5 | 6 | 7 |
| f(n) | 2 | 16 | 54 | 128 | 250 | 432 | 686 |
Challenge: Find the equation that models the function.
A printable version of this activity is available for classroom use. Finite Differences Lab