
If you type data into your calculator and it appears to be linear, it can find the equation of the line for you. This process is called performing a linear regression.
Calculator Set Up
- Make sure that your calculator has the Plots Off, Y= functions cleared, the MODE and FORMAT are set at “stage left”, and the lists are cleared.
- Turn the Diagnostics on.
- Press 2nd the CATALOG (2nd of 0). Press the teal D button (ALPHA of x-1) This brings you to the items in the catalog that start with D.
- Arrow down until you reach the command DiagnosticOn and press ENTER.
- Press ENTER a second time. Later, when you perform a linear regression, you will see an “r” value. If that value is close to a ±1 there’s a strong correlation to the data, meaning the data points can be modeled by the line well.
Enter the Data
Data for this lab will be stored in L1 and L2.
- Press the STAT menu and choose option 1:Edit…
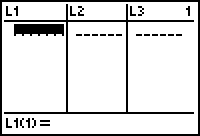
- Type the first value in the L1 table, then press ENTER, type the second value next, and so forth.
- Arrow over to the L2 table and enter the corresponding dependent values
- Make sure there is an equal amount of data in both L1 and L2 so you don’t get a “dim mismatch” error.
Performing a Linear Regression
- To view your data, you must set up a stat plot. Press 2nd STAT PLOT (2nd of Y=). Press
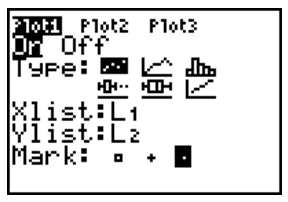 ENTER to set up Stat plot 1. Set up your stat plot to look like the one at the right. Then press the ZOOM key and choose option 9:ZoomStat.
 - To find an equation that matches the data you see, you need to perform a linear regression on the data. Press the STAT menu and arrow to the right to the CALC menu. Choose option 4:LinReg (ax+b). Type L1, a comma, L2, then the VARS button, arrow over to Y-VARS, choose 1:Function, the 1:Y1 option, then press ENTER.
When you press the GRAPH button a line that matches your data points will also be in your viewing window. Pressing the Y= button will give you the equation of that line.
Let’s have the calculator find the line of best fit for wing length vs. wing-beat rate.
| Flamingo | Shell Duck | Velvet Scooter | Fulmar | Great Egret | |
| Wing Length (mm) | 400 | 375 | 281 | 321 | 437 |
| Wing-Beat Rate (bps) | 2.4 | 3.0 | 4.3 | 3.6 | 2.1 |
Equation of your line _________________________
Correlation Coefficient ________________
A giant hummingbird beats its wings 10-15 times per second. Based on the model above, how long should its wing be?
A printable version of this activity is available for classroom use. Linear Regressions on TI Graphing Calculators