
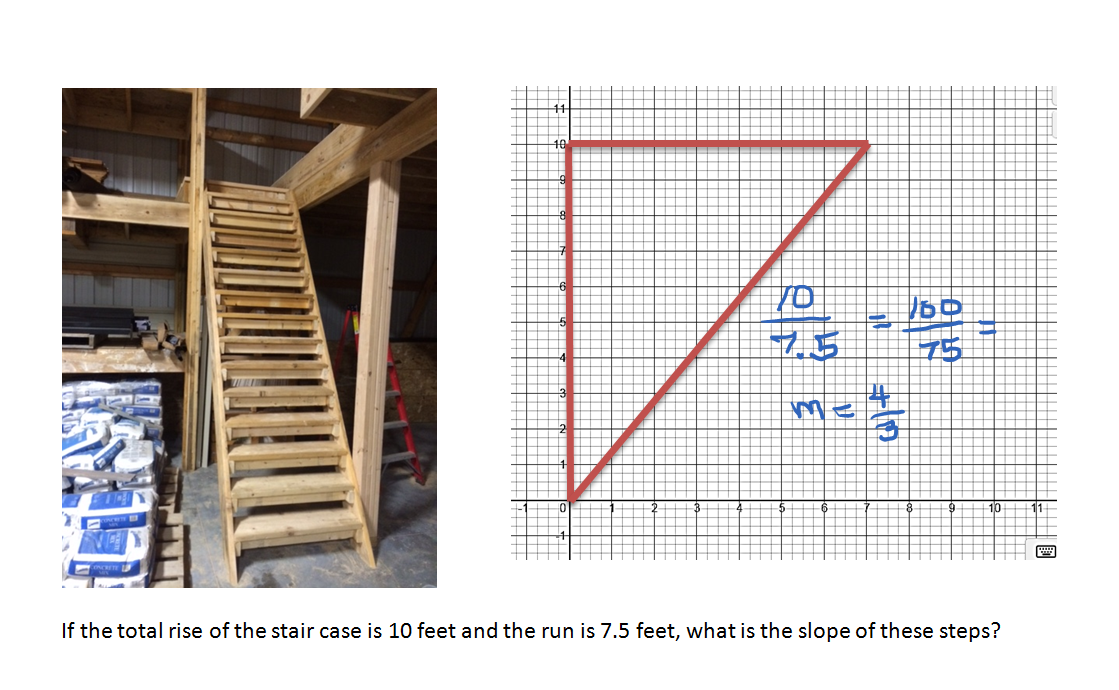
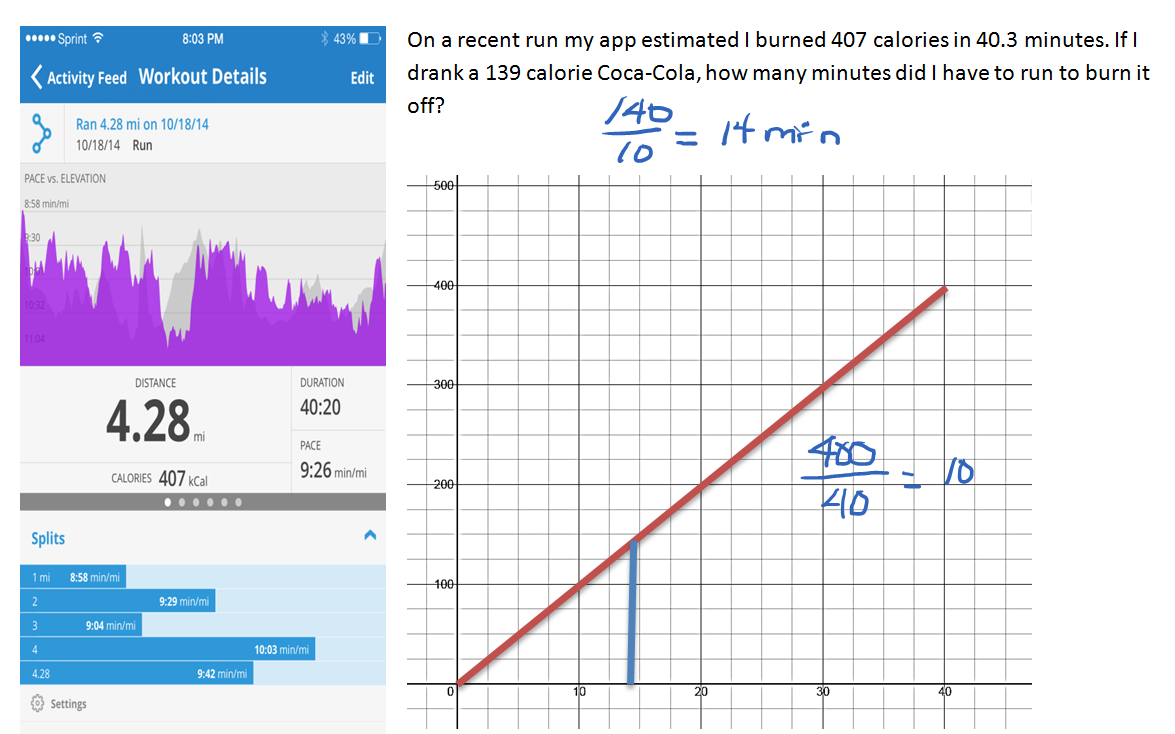
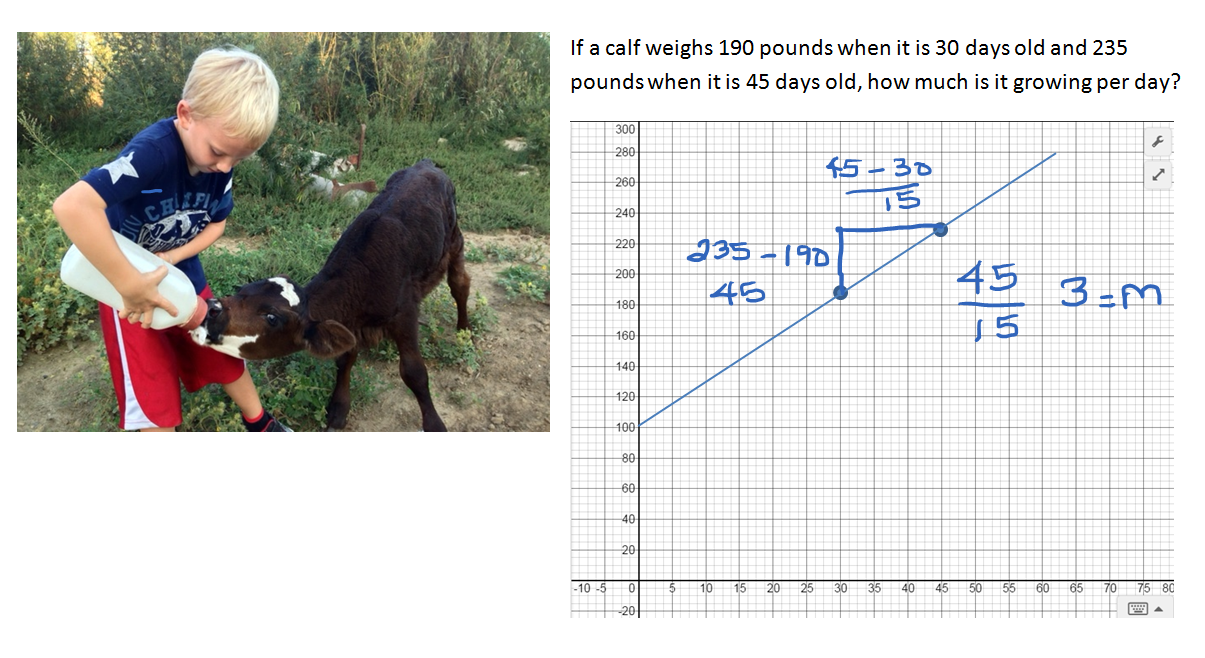
The following are real world applications of slope as a rate of change. Graphing the examples can help you visualize what is happening. In the first example, a narrow, steep staircase was built to conserve floor space. The second example helps determine how long one must exercise to burn off a sweet treat. The third is a calculation to determine if an orphaned calf is growing at an acceptable rate.
If the total rise of the stair case is 10 feet and the run is 7.5 feet, what is the slope of these steps?
Slope is not just for changes in elevation. It can be used to show how much other things are changing as well.
Slope can be used to determine how fast a feeder calf is growing.
The slope of a line can be positive, negative, zero, or undefined.
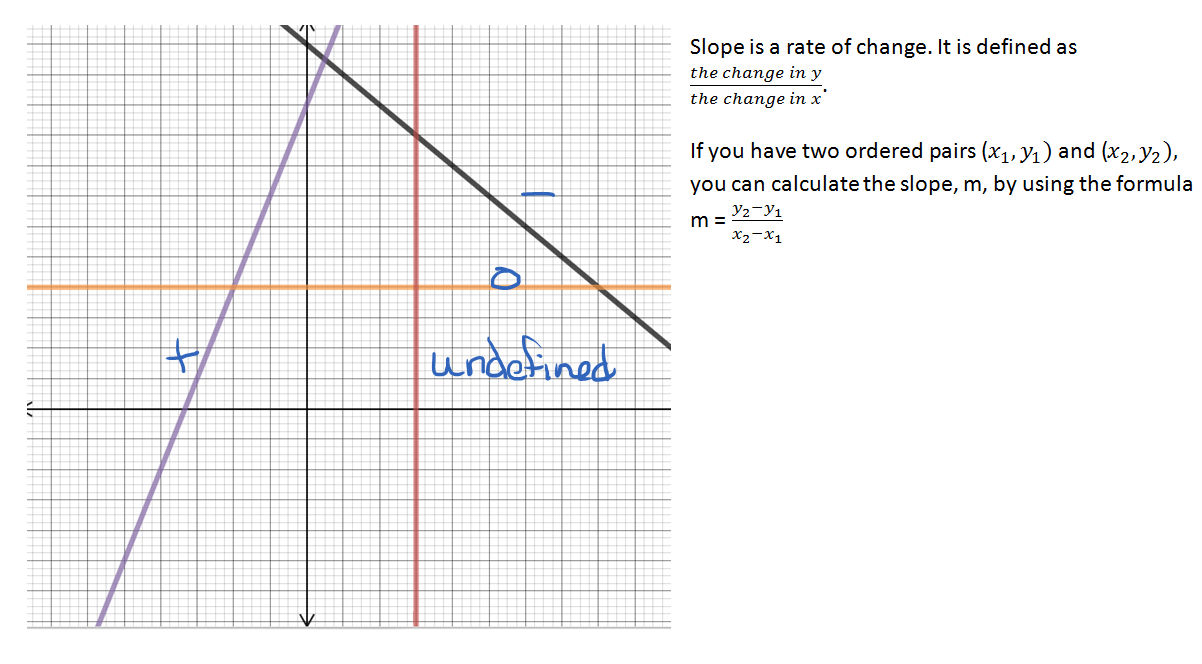
If the line rises as you follow it from left to right, it has a positive slope. If it falls as you follow it from left to right, it has a negative slope. A horizontal line has zero slope. A vertical line has an undefined slope.
You can calculate the slope of a line by finding the change in y over the change in x.

Related Article: Slope Y-Intercept
Investigate further: See the Work It Out Calculator to determine whether the MapMyRun app and our calculations agree with the Calorie Counter’s estimate of how long it takes to run off a Coca Cola.