
Calculator Set Up
- Make sure that your calculator has the Plots Off, Y= functions cleared, the MODE and FORMAT are set at “stage left”, and the lists are cleared.
- Turn the Diagnostics on.
- Press 2nd the CATALOG (2nd of 0). Press the teal D button (ALPHA of x-1) This brings you to the items in the catalog that start with D.
- Arrow down until you reach the command DiagnosticOn and press ENTER.
- Press ENTER a second time. Later, when you perform a linear regression, you will see an “r” value. If that value is close to a ±1 there’s a strong correlation to the data, meaning the data points can be modeled by the line well.
Enter the Data
Data for this activity will be stored in L1 and L2.
- Press the STAT menu and choose option 1:Edit…
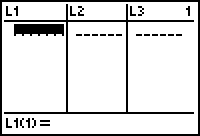
- Type the first value in the L1 table, then press ENTER, type the second value next, and so forth.
- Arrow over to the L2 table and enter the corresponding dependent values
- Make sure there is an equal amount of data in both L1 and L2 so you don’t get a “dim mismatch” error.
Performing a Regression
- To view your data, you must set up a stat plot. Press 2nd STAT PLOT (2nd of Y=). Press
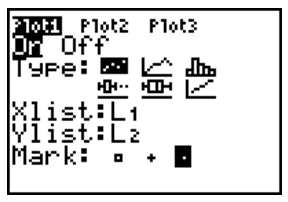 ENTER to set up Stat plot 1. Set up your stat plot to look like the one at the right. Then press the ZOOM key and choose option9:ZoomStat.
 - To find an equation that matches the data you see, you need to perform a regression on the data. Press the STAT menu and arrow to the right to the CALC menu. Choose the option that most closely represents the appearance of your data. For example, if your data looks linear, choose 4:LinReg (ax+b). Type L1, a comma, L2, then the VARS button, arrow over to Y-VARS, choose 1:Function, the 1:Y1 option, then press ENTER.
When you press the GRAPH button a line/curve that matches your data points will also be in your viewing window. Pressing the Y= button will give you the equation of that line/curve.

Leave A Comment