Graphing Calculator

/Graphing Calculator

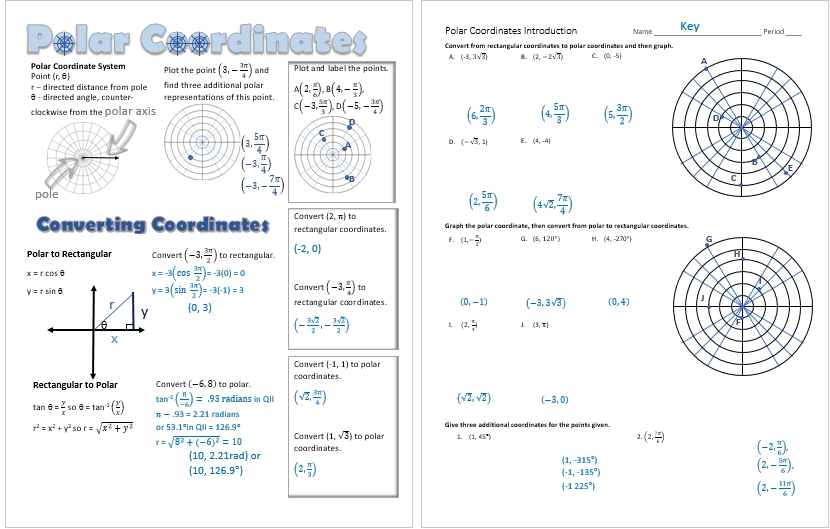
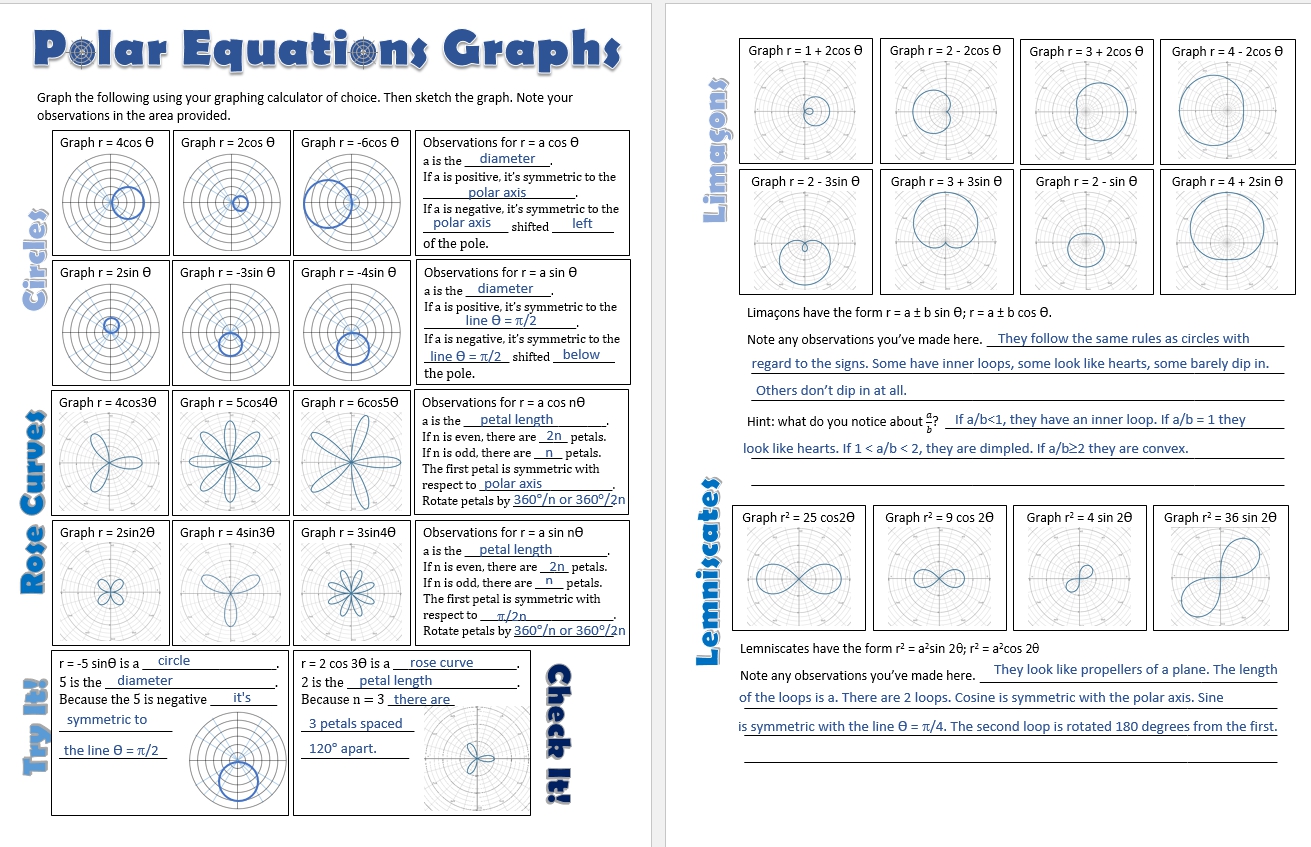
Polar Coordinates and Graphs

I remember being frightened by the polar coordinate system and graphing equations using it when I was in my students' seats many years ago. With graphing calculators, this doesn't have to be intimidating. I started the unit with an introduction to the polar coordinate system and reminded my students about how intimately familiar they are [...]

By | 2019-02-07T20:50:54+00:00 April 9th, 2017|Graphing Calculator, PreCalculus|0 Comments

Equations from Data

When businesses, governments and other policy makers prepare to make decisions, they often look at data to find trends. In this activity, we will use data and a graphing calculator, Desmos, or Geogebra to find an equation that best fits the data points. Statista has Global Apple iPod sales (in million units). Plot the data [...]

By | 2018-09-24T20:39:28+00:00 September 25th, 2016|Graphing Calculator, PreCalculus, Statistics|0 Comments

Find an equation of best fit in Geogebra

Go to Geogebra.org. Click on Geogebra Math Apps. Choose Spreadsheet. Enter your data in the spreadsheet. Click in the graph area, then right click and choose Graphics. In the Basic tab, change your x- and y- mins and maxes to represent your data points. Click on the Grid tab and Show Grid if you want. [...]

By | 2017-11-13T22:01:55+00:00 September 24th, 2016|Graphing Calculator, PreCalculus, Statistics|2 Comments

Could Nebraska Rely Exclusively on Wind Energy in Your Lifetime?

President Obama announced his carbon pollution standards for power plants on 8/03/2015. In it he outlines a 32% cut in carbon dioxide emissions by 2030. Currently, Nebraska gets about 72% of its electricity from coal. According to the American Wind Energy Association, Nebraska has the potential of meeting more than 118 times the state's current electrical [...]

By | 2017-11-13T22:02:01+00:00 August 3rd, 2015|Graphing Calculator, PreCalculus|0 Comments

How to Demonstrate Graphing Calculator Steps

Texas Instruments has dominated the graphing calculator market since the TI-81 debuted in 1990. Despite the fact that many free graphing calculator apps for smart phones and tablets are more than capable of performing the same tasks, the calculators stubbornly hold their market share. The advantage lies in the fact that many TI calculators are [...]

By | 2017-11-13T22:02:02+00:00 February 11th, 2015|Algebra II, Graphing Calculator, PreCalculus|0 Comments

Tidal Range

Low Tide Versus High Tide   These images show low tide and high tide on January 19, 2011 near the Golden Gate NOAA tide gauge in the San Francisco Bay. The question is, is this normal or is there cause for concern? Data from the tide gauge for this time frame is available from the [...]

By | 2017-11-13T22:02:03+00:00 January 25th, 2015|Algebra II, Graphing Calculator, PreCalculus|0 Comments