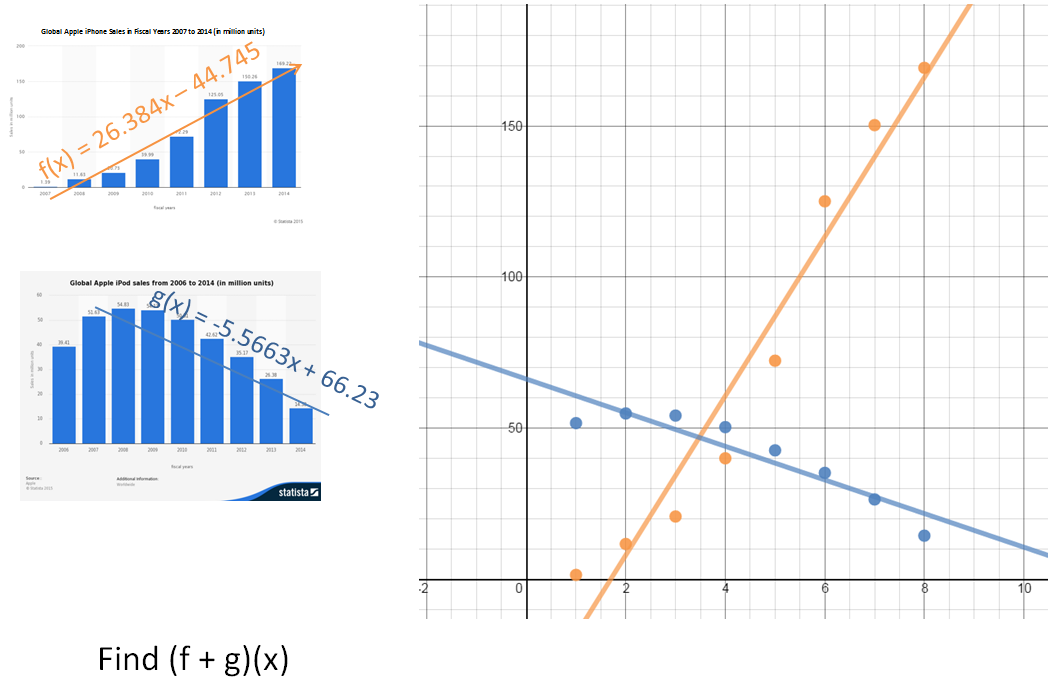
Statistics

/Statistics

Equations from Data

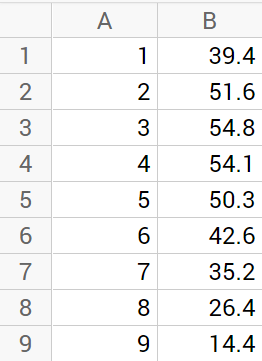
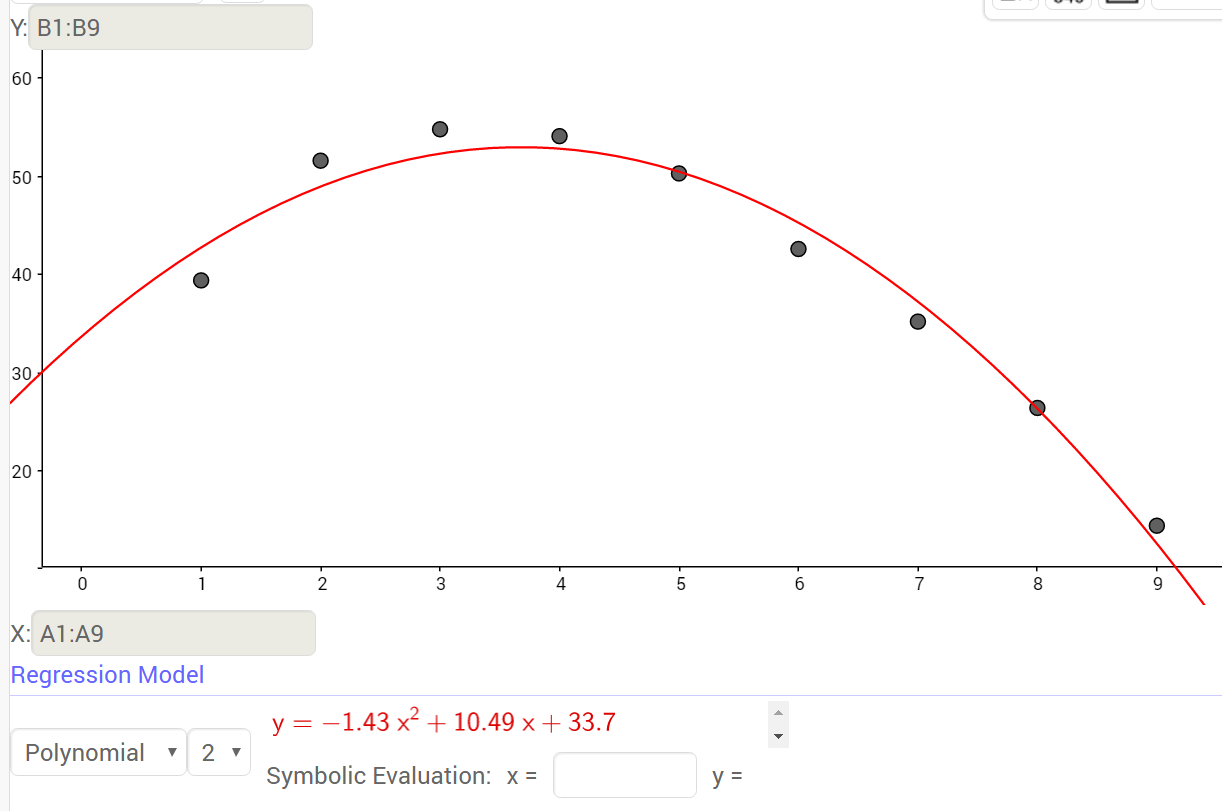
When businesses, governments and other policy makers prepare to make decisions, they often look at data to find trends. In this activity, we will use data and a graphing calculator, Desmos, or Geogebra to find an equation that best fits the data points. Statista has Global Apple iPod sales (in million units). Plot the data [...]

By | 2018-09-24T20:39:28+00:00 September 25th, 2016|Graphing Calculator, PreCalculus, Statistics|0 Comments

Find an equation of best fit in Geogebra

Go to Geogebra.org. Click on Geogebra Math Apps. Choose Spreadsheet. Enter your data in the spreadsheet. Click in the graph area, then right click and choose Graphics. In the Basic tab, change your x- and y- mins and maxes to represent your data points. Click on the Grid tab and Show Grid if you want. [...]

By | 2017-11-13T22:01:55+00:00 September 24th, 2016|Graphing Calculator, PreCalculus, Statistics|2 Comments

Using Normal Distributions

A normal distribution is one type of probability distribution. It has a bell-shaped curve. Normal distributions are often used when calculating grades and curving them based on the standard deviation. The notes sheet below asks students to use what they know about the mean and standard deviation to fill out a normal distribution template for the [...]

By | 2017-11-13T22:01:56+00:00 February 22nd, 2016|Algebra II, Statistics|0 Comments

Combinations of Functions and Composite Functions

Composite functions are a combination of two functions. The traditional math course introduces them like this: Let f and g be functions with overlapping domains. Then for all x common to both domains: (f + g)(x) = f(x) + g(x) (f - g)(x) = f(x) - g(x) (fg)(x) = f(x) · g(x) (f/g)(x) = f(x) / [...]

By | 2017-11-13T22:02:00+00:00 August 26th, 2015|PreCalculus, Statistics|0 Comments

What Americans Spend on Holidays

The National Retail Foundation sends out press releases that outline their predictions for consumer spending each holiday season. The 2007 - 2009 recession is quite evident in the dips in the charts of the predictions. Some economists argue that due to unemployment and under-employment Americans have not yet fully recovered from the effects of the [...]

By | 2017-11-13T22:02:02+00:00 February 28th, 2015|Algebra, Statistics|0 Comments