- Go to Geogebra.org.
- Click on Geogebra Math Apps.
- Choose Spreadsheet.
- Enter your data in the spreadsheet.
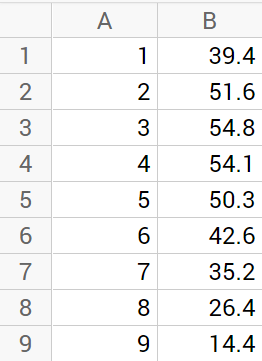
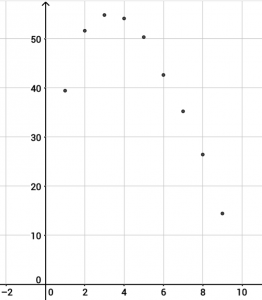
- Click in the graph area, then right click and choose Graphics.
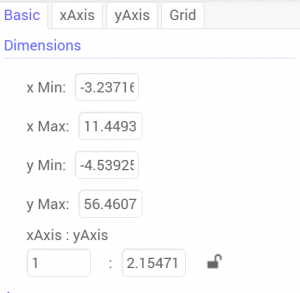
- In the Basic tab, change your x- and y- mins and maxes to represent your data points.
- Click on the Grid tab and Show Grid if you want. Then click the X to close the properties dialog box.
- Highlight your data in the spreadsheet, then right click on it.
- Choose Create > List of Points.
- Click on the Menu icon in the upper right and choose View and check Input Bar.
- The Input Bar appears in the bottom of your screen. Type y=a*(x-h)^2 + k and press Enter. When a dialog box pops up, click Create Sliders.
- Click on a slider and choose the Set label style button to show the Name and Value.
- Right click on a slider and choose Object Properties. Adjust the Min: and Max: and Increment: for each of your three sliders to reflect your data.
- Move your sliders until they represent your data. Note your equation.
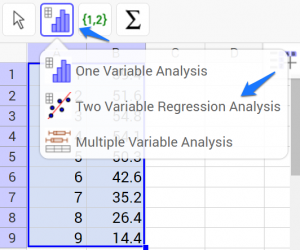
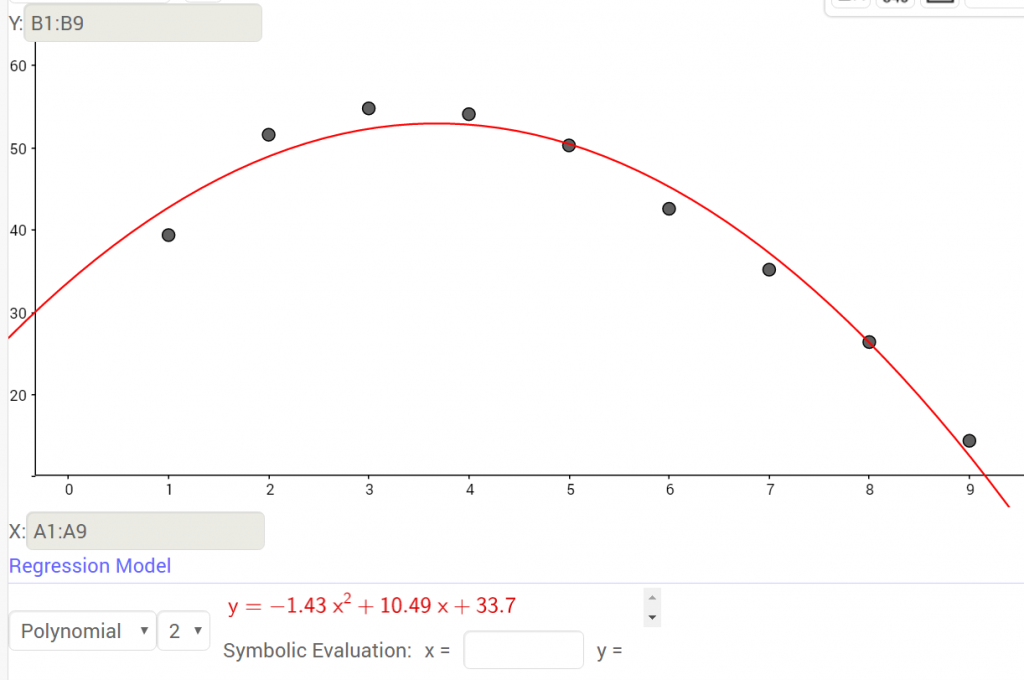
- To see how your equation compares to the one Geogebra calculates, select the data in the spreadsheet.
- Choose the table – bar graph icon. Choose Two Variable Regression Analysis.
- The data from this table most closely represents a quadratic so choose Polynomial.
- How did the equation you created using the sliders compare to the Geogebra Regression Model?




thank you for the guides, really helped me a lot
I’m glad they helped!