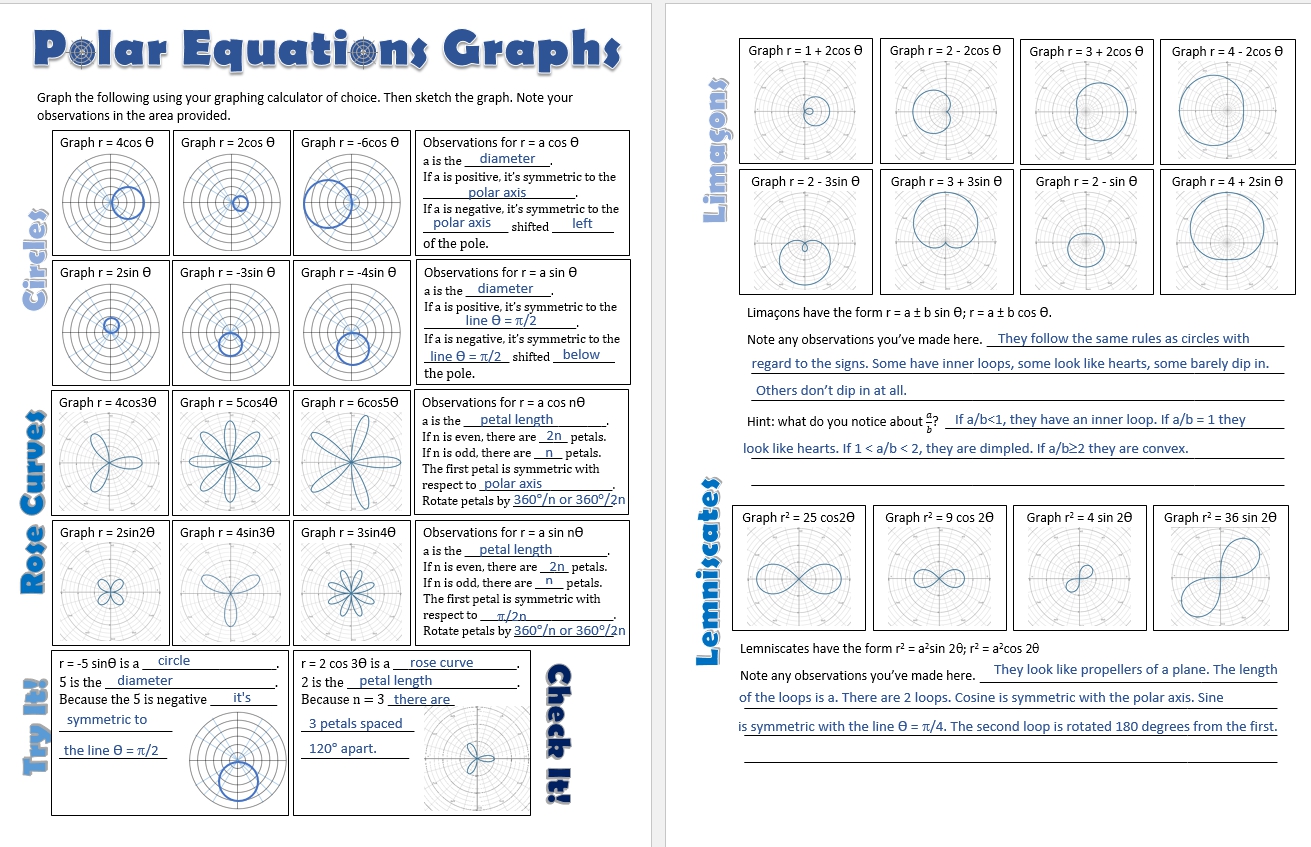
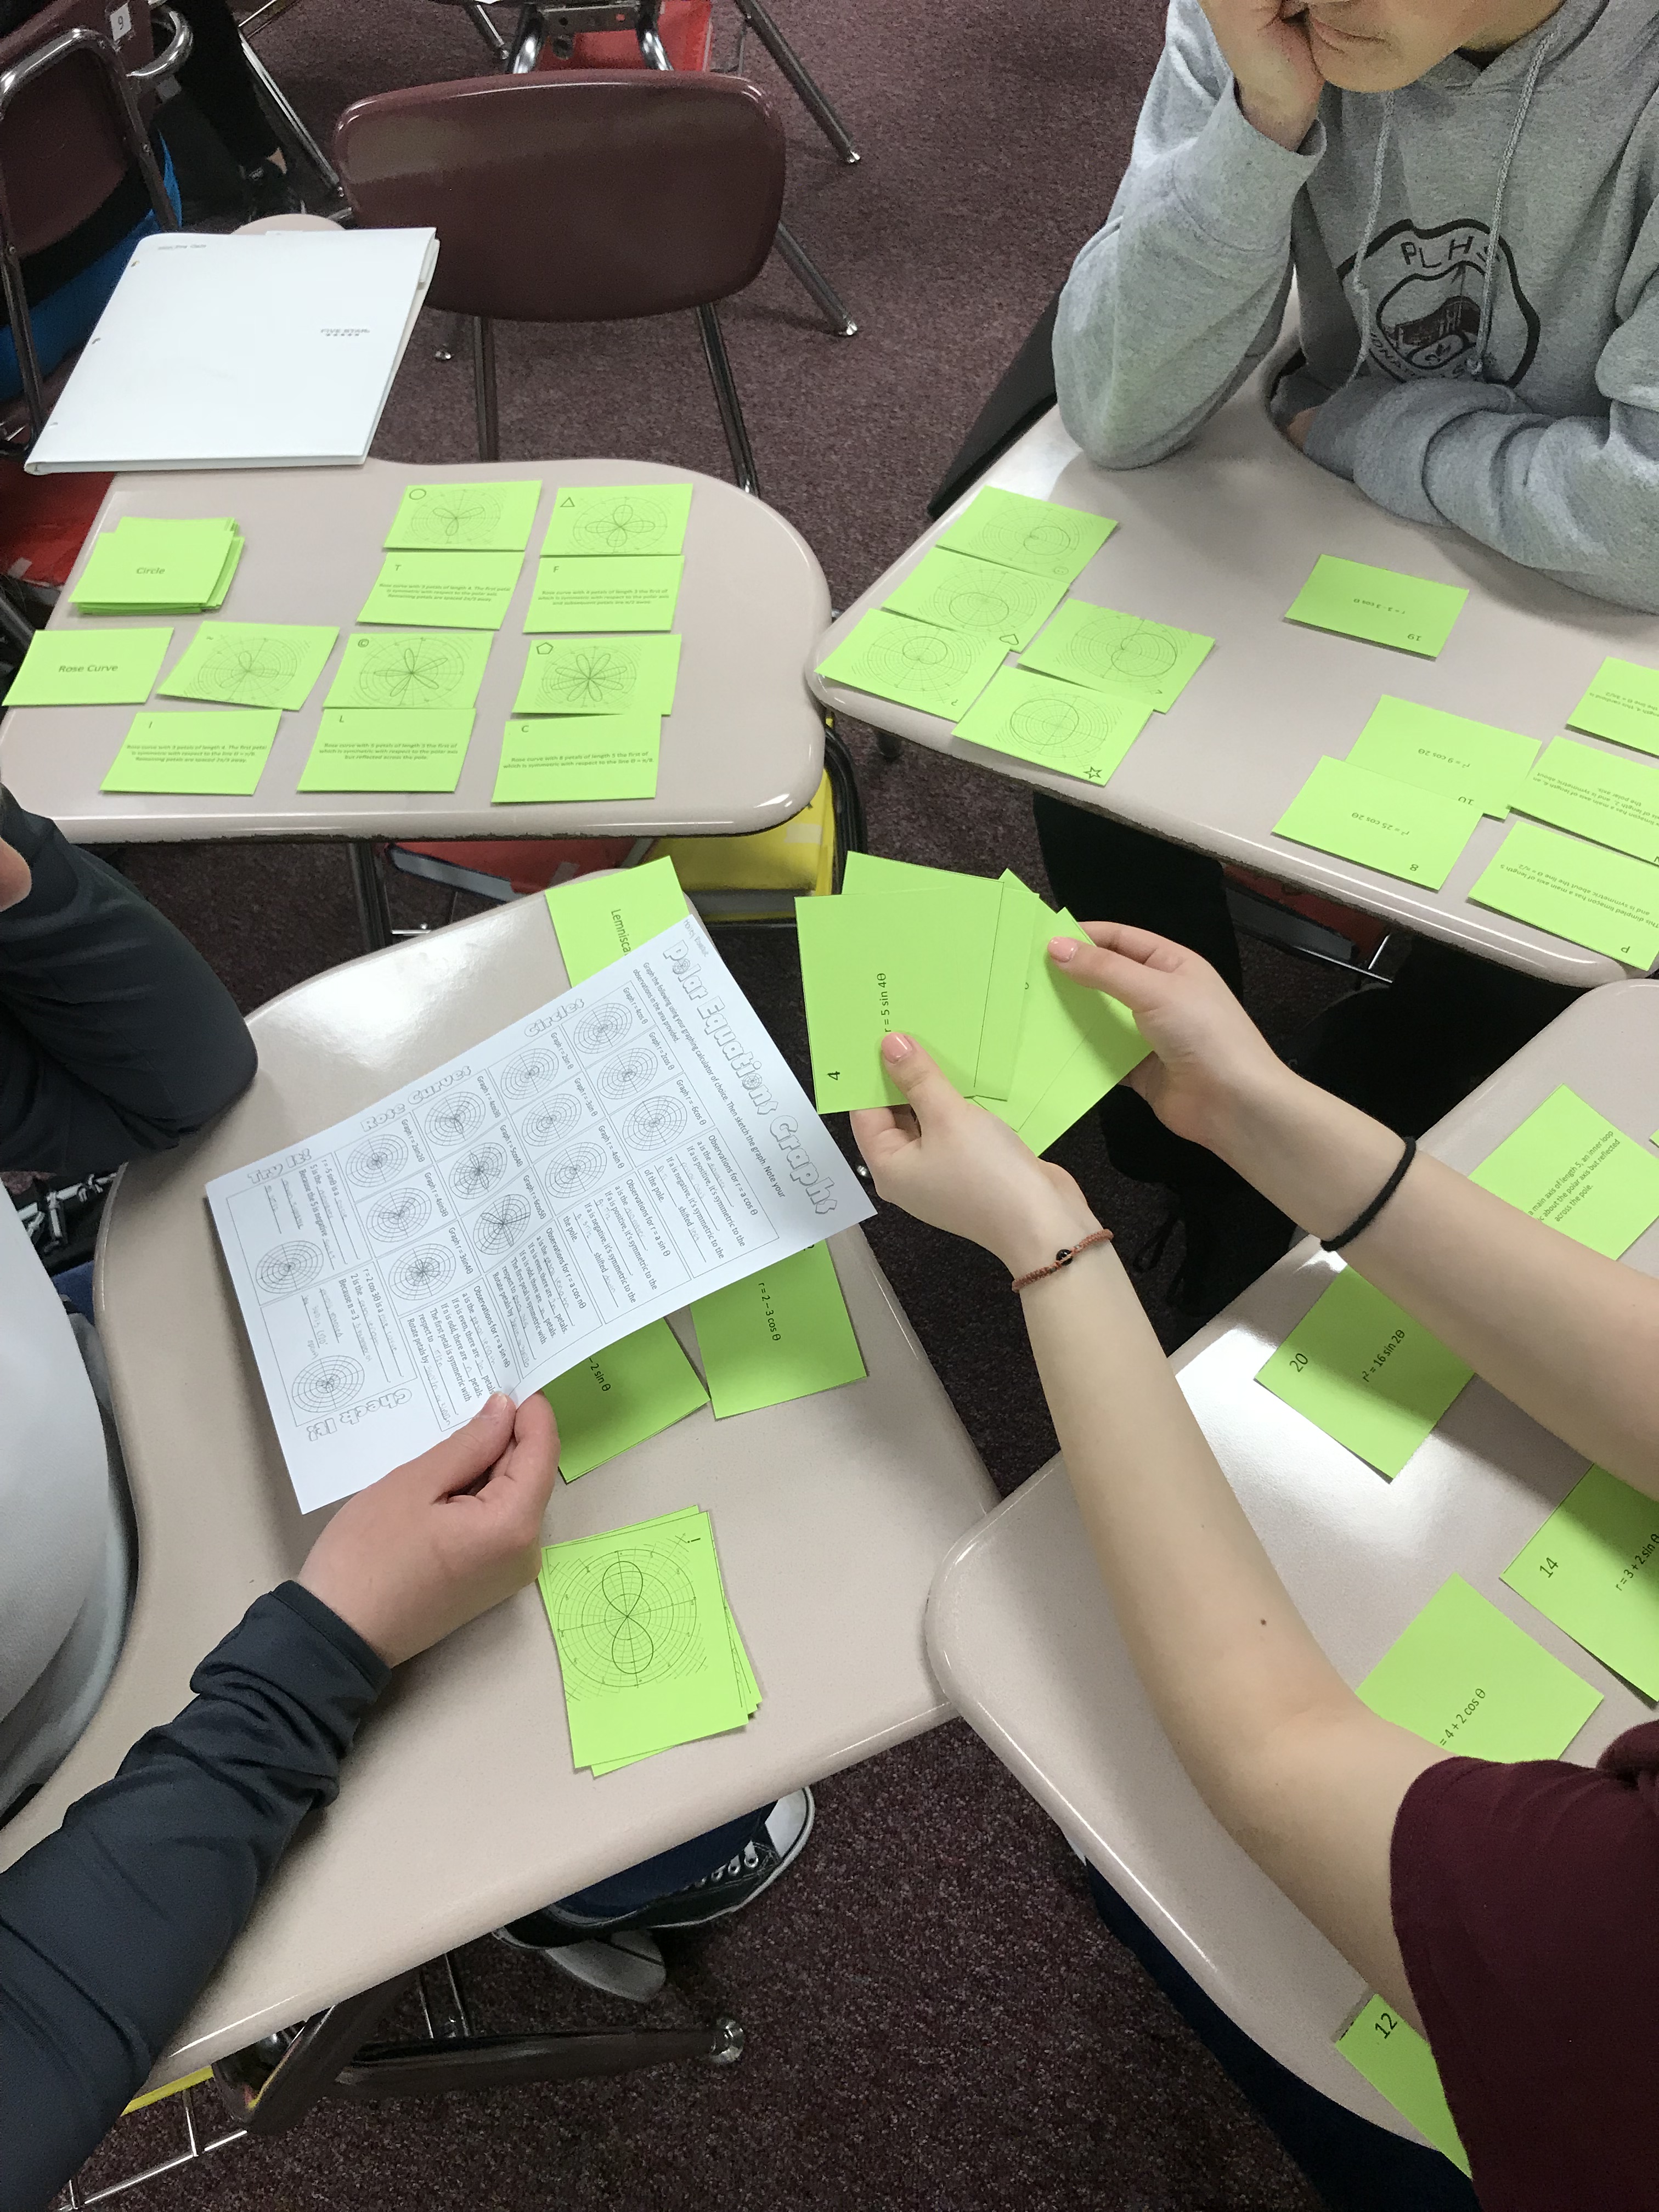
PreCalculus

/PreCalculus

Foci of Parabolas Exploration

You have to love the Internet and the inspiration you get from other teachers. I put together an investigation based on the tweet below.   Inspired by a session at #T3IC last year, we used lasers to find "mystery points" (foci) of parabolas based on their lines of reflection. The conversations turned to satellites, flashlights, [...]

By | 2018-03-25T20:31:58+00:00 March 25th, 2018|Algebra II, PreCalculus|1 Comment

Marginless Domain and Range Cards

I was intrigued by Sarah Carter's Domain and Range Cards on her Math=Love blog. I was afraid I would lose a lot of time having my students cut out the cards, so I made border-less cards with functions my Pre-Calculus students will see throughout the year. Pages 1 and 2 are the framework for the [...]

By | 2017-11-13T22:01:53+00:00 October 23rd, 2017|Algebra II, PreCalculus|0 Comments

Polar Coordinates and Graphs

I remember being frightened by the polar coordinate system and graphing equations using it when I was in my students' seats many years ago. With graphing calculators, this doesn't have to be intimidating. I started the unit with an introduction to the polar coordinate system and reminded my students about how intimately familiar they are [...]

By | 2019-02-07T20:50:54+00:00 April 9th, 2017|Graphing Calculator, PreCalculus|0 Comments

Sequences, Series, & Probability

Based on feedback from my geometry students, I've created some Vizual Notes for my pre-calculus classes as well. Sequences and Series This notes sheet can be used to help explain the the vocabulary involved withe sequences and series - explicit, recursive, summation, factorial, etc. It helps prepare students for Arithmetic and Geometric Sequences. Arithmetic Sequences [...]

By | 2019-02-07T20:55:56+00:00 November 13th, 2016|Algebra II, PreCalculus|0 Comments

Equations from Data

When businesses, governments and other policy makers prepare to make decisions, they often look at data to find trends. In this activity, we will use data and a graphing calculator, Desmos, or Geogebra to find an equation that best fits the data points. Statista has Global Apple iPod sales (in million units). Plot the data [...]

By | 2018-09-24T20:39:28+00:00 September 25th, 2016|Graphing Calculator, PreCalculus, Statistics|0 Comments