Stacie

/Stacie Bender

About Stacie Bender

This author has not yet filled in any details.
So far Stacie Bender has created 97 blog entries.

Systems of Equations and Inequalities

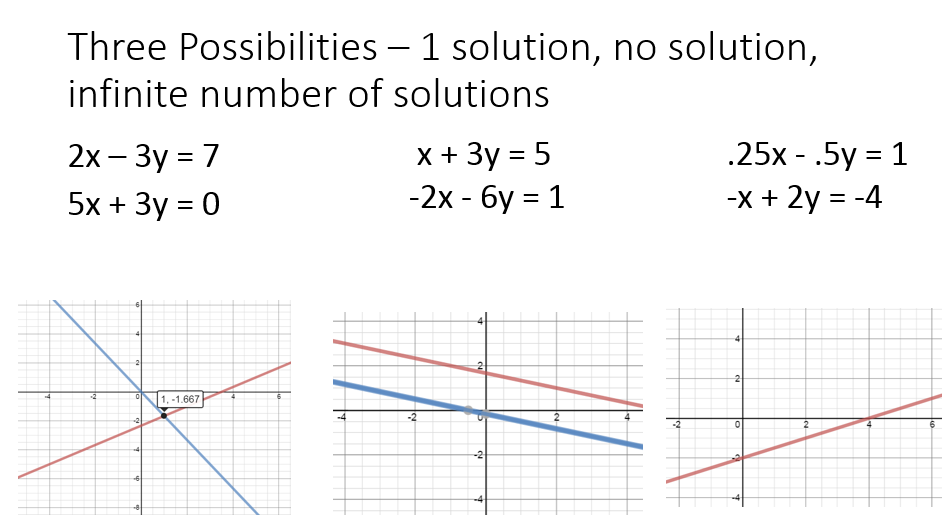
When you are given two lines, there are many ways to determine if and where they intersect. You can graph them, solve by substitution, solve by elimination, and use matrices to solve. Two-Variable Linear Systems Solving systems by elimination is the focus of this video. https://youtu.be/80_Mlz7t_ko Two-Variable Linear Systems Section 7.2 notes Multi-Variable Linear Systems [...]

By | 2017-11-13T22:02:00+00:00 October 21st, 2015|PreCalculus|0 Comments

Solving Quadratic Equations

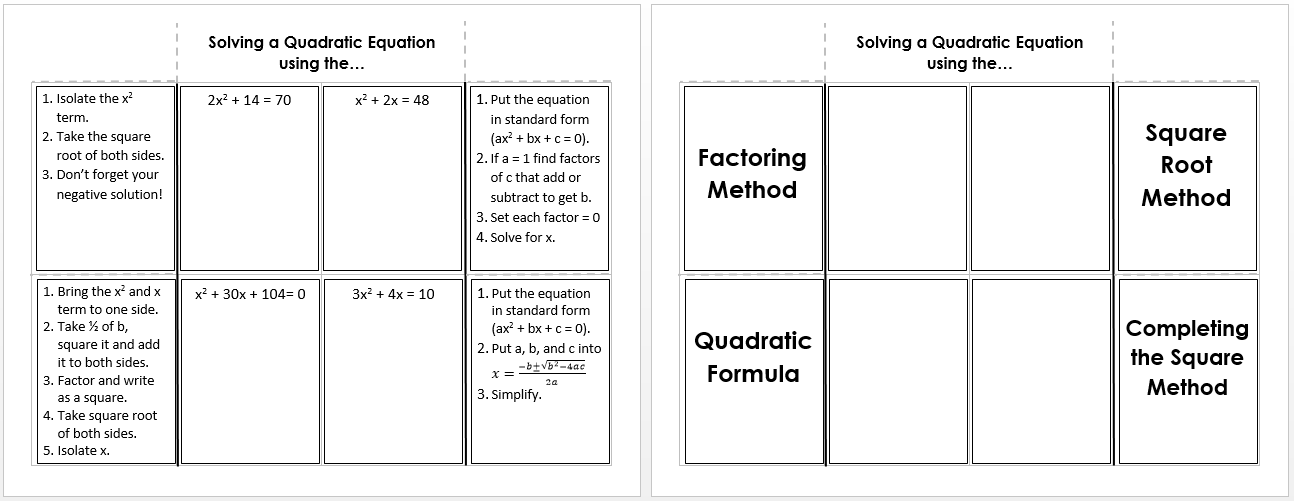
There are many ways to solve quadratic equations. The resources below can help you remember key concepts, discover new methods, and fine tune your skills. Solving by factoring and graphing is a worksheet that contains three types of equations - perfect square trinomials, difference of squares, and factoring trinomials to solve. It also has two solving [...]

By | 2017-11-13T22:02:00+00:00 September 25th, 2015|Algebra II, Algebra Tiles, PreCalculus|0 Comments

Quadratics Galore!

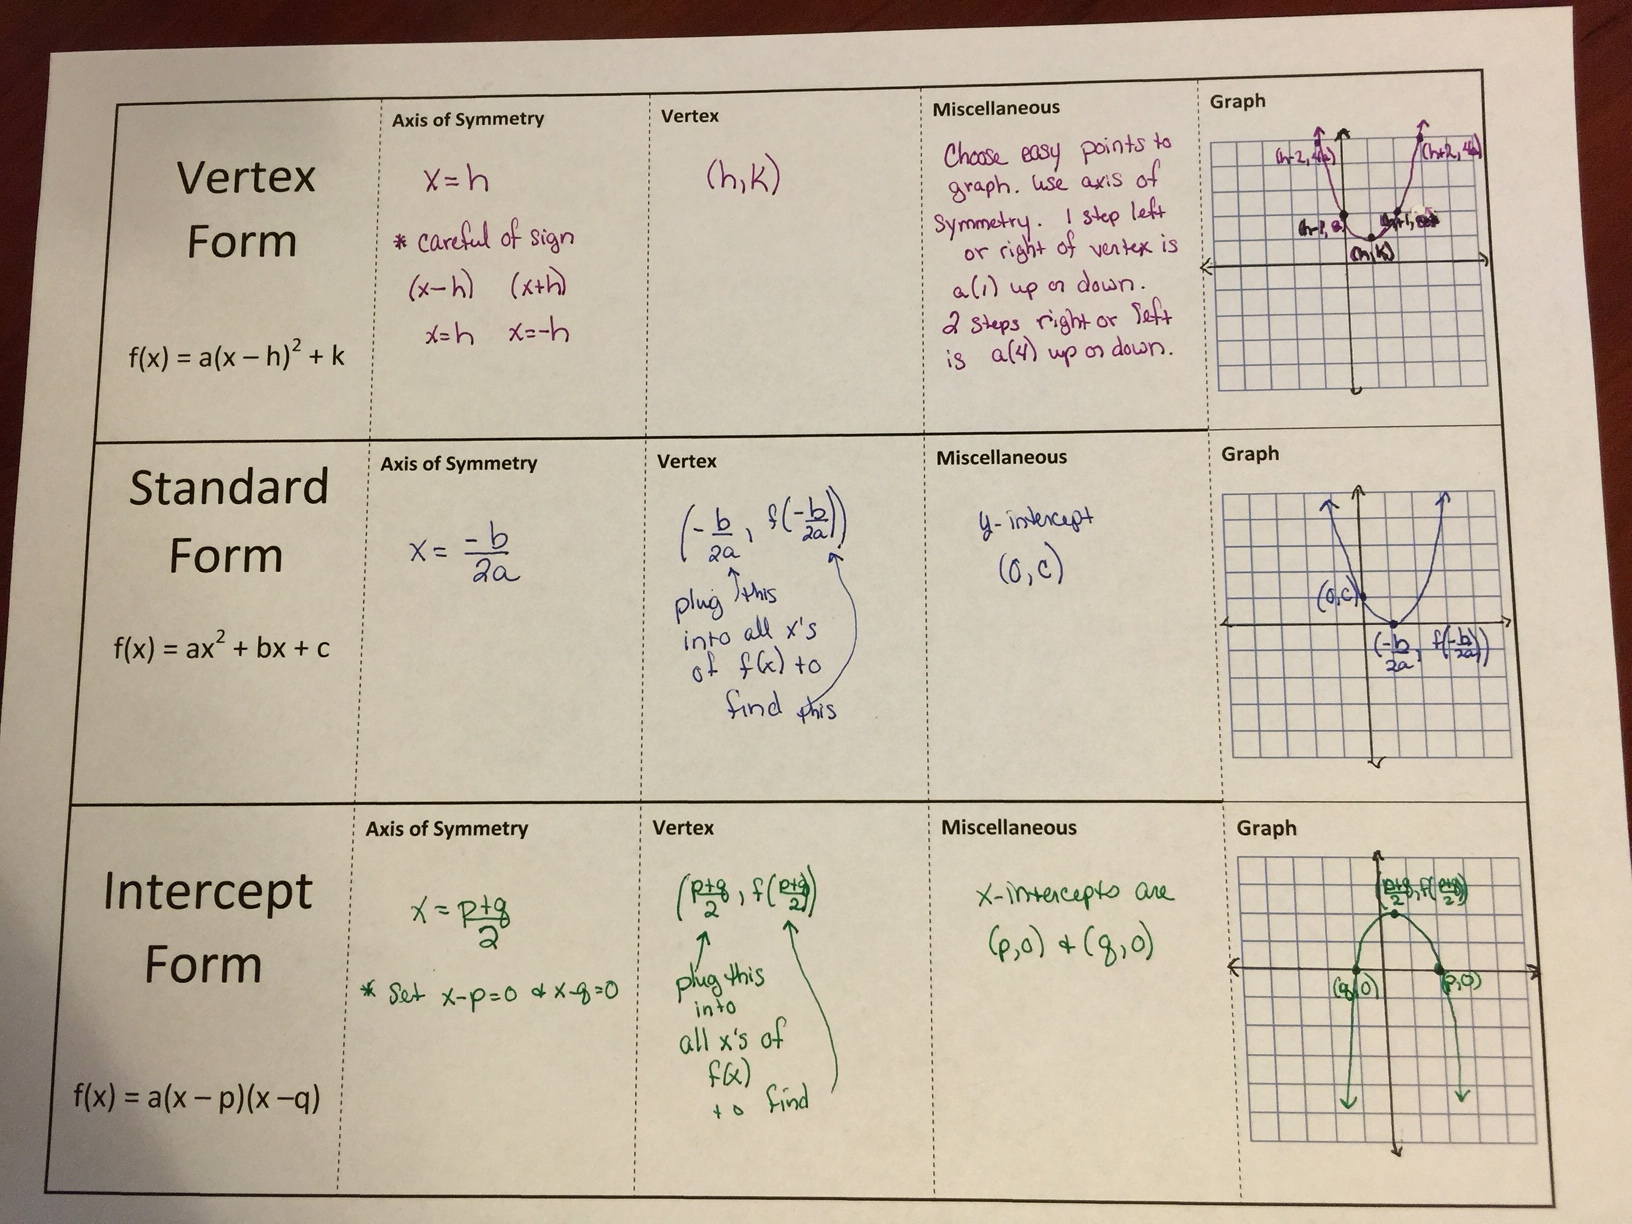
Graphing quadratic functions can be overwhelming. Not only are you working with translations and transformations, but a quadratic function can be written in three different forms. Follow the steps below and check your work using Desmos and you will be a pro in no time.     An accordion style foldable adapted from High Heels [...]

By | 2017-11-13T22:02:00+00:00 September 13th, 2015|Algebra II, PreCalculus|0 Comments

Combinations of Functions and Composite Functions

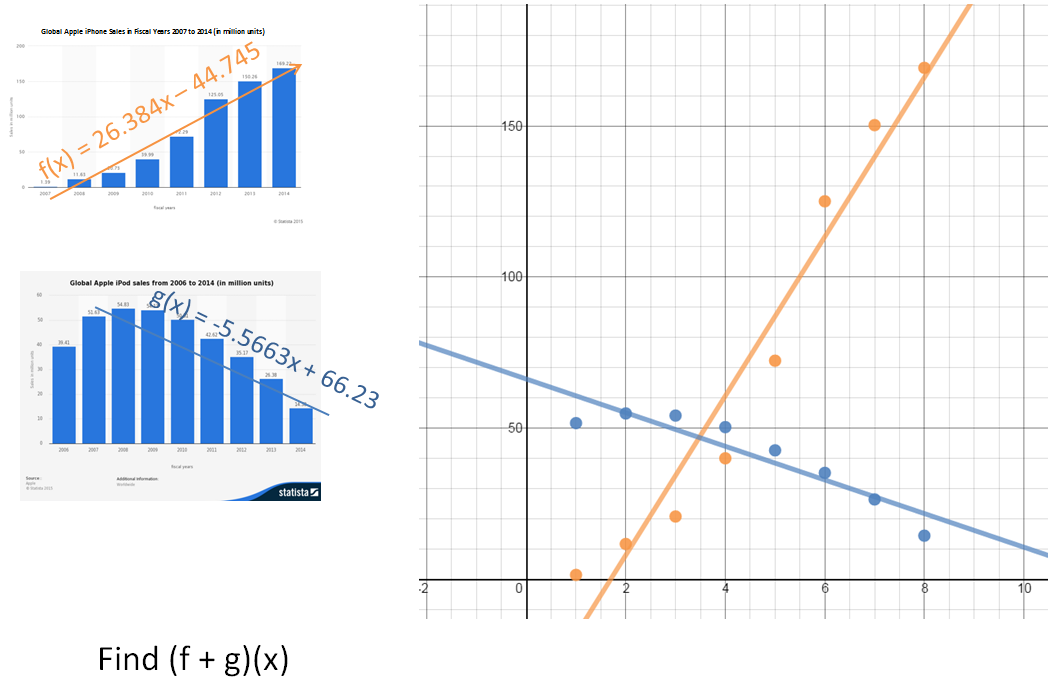
Composite functions are a combination of two functions. The traditional math course introduces them like this: Let f and g be functions with overlapping domains. Then for all x common to both domains: (f + g)(x) = f(x) + g(x) (f - g)(x) = f(x) - g(x) (fg)(x) = f(x) · g(x) (f/g)(x) = f(x) / [...]

By | 2017-11-13T22:02:00+00:00 August 26th, 2015|PreCalculus, Statistics|0 Comments

Graphical Symmetry

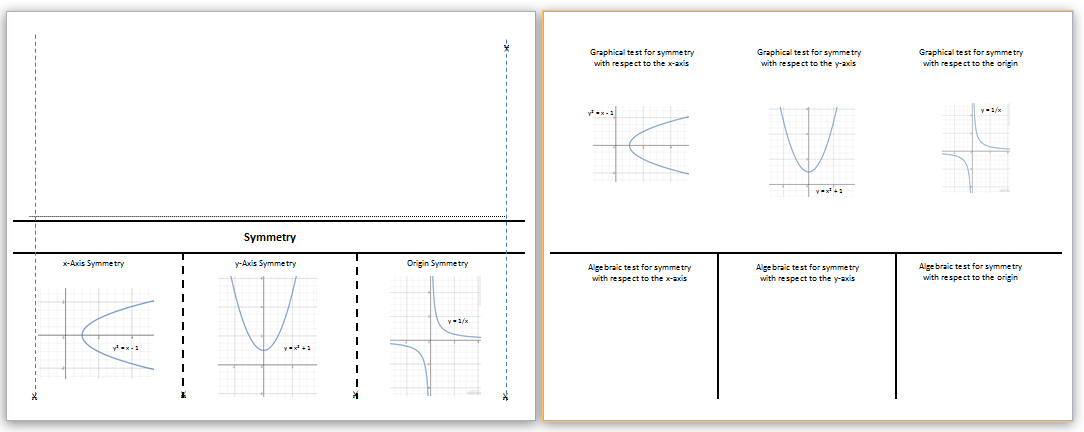
There are three types of graphical symmetry you may be responsible for: x-axis, y-axis, and origin. Knowing the properties of symmetry can help you when sketching complex graphs. x-Axis Symmetry If an equation or function is symmetric with respect to the x-axis. you can fold the paper it is graphed on along the x-Axis and [...]

By | 2017-11-13T22:02:00+00:00 August 16th, 2015|PreCalculus|0 Comments

Rectangular Coordinates

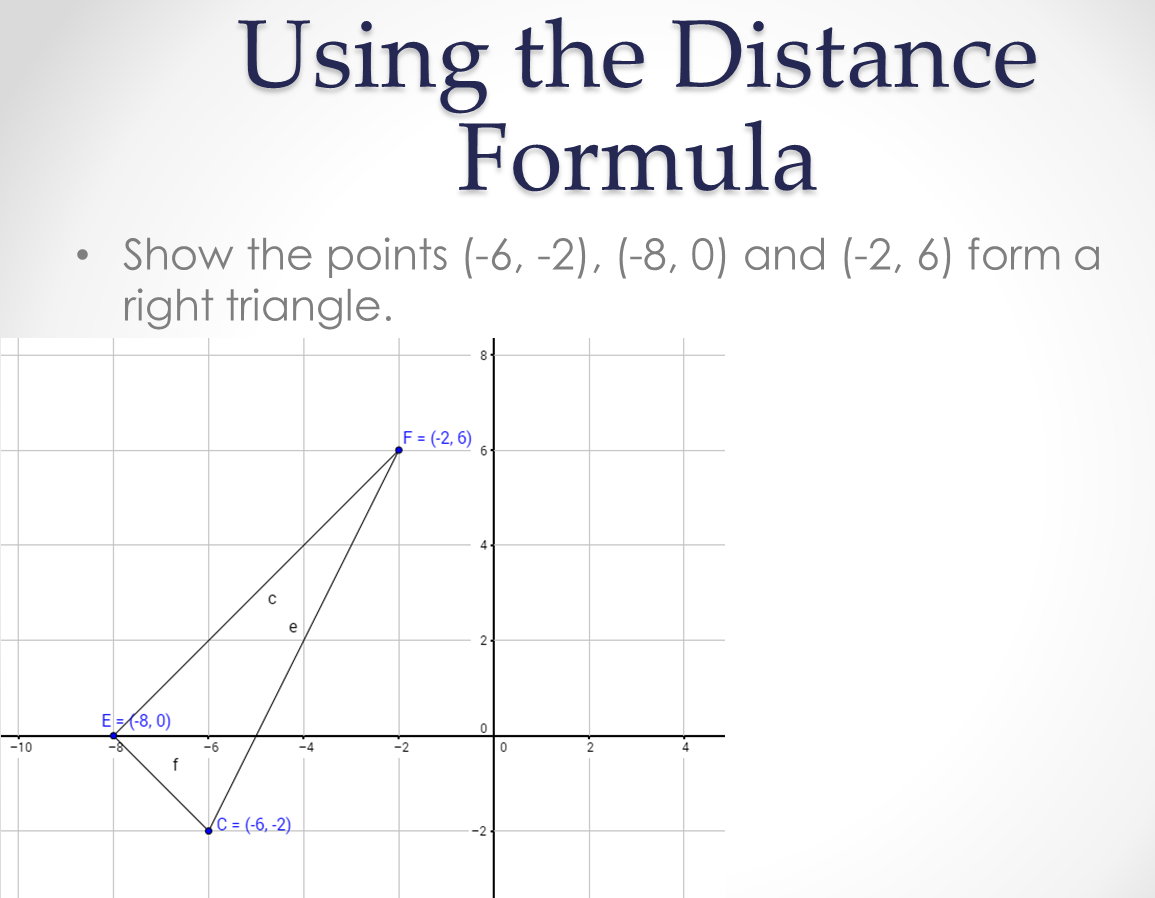
Coordinate Plane The coordinate plane is used to represent ordered pairs of real numbers by points in a plane and determine relationships between those points and the segments, lines or curves that connect them.   The axes form four quadrants. The x values are positive from the origin to the right and are negative from [...]

By | 2017-11-13T22:02:01+00:00 August 16th, 2015|PreCalculus|0 Comments

Angle Relationships

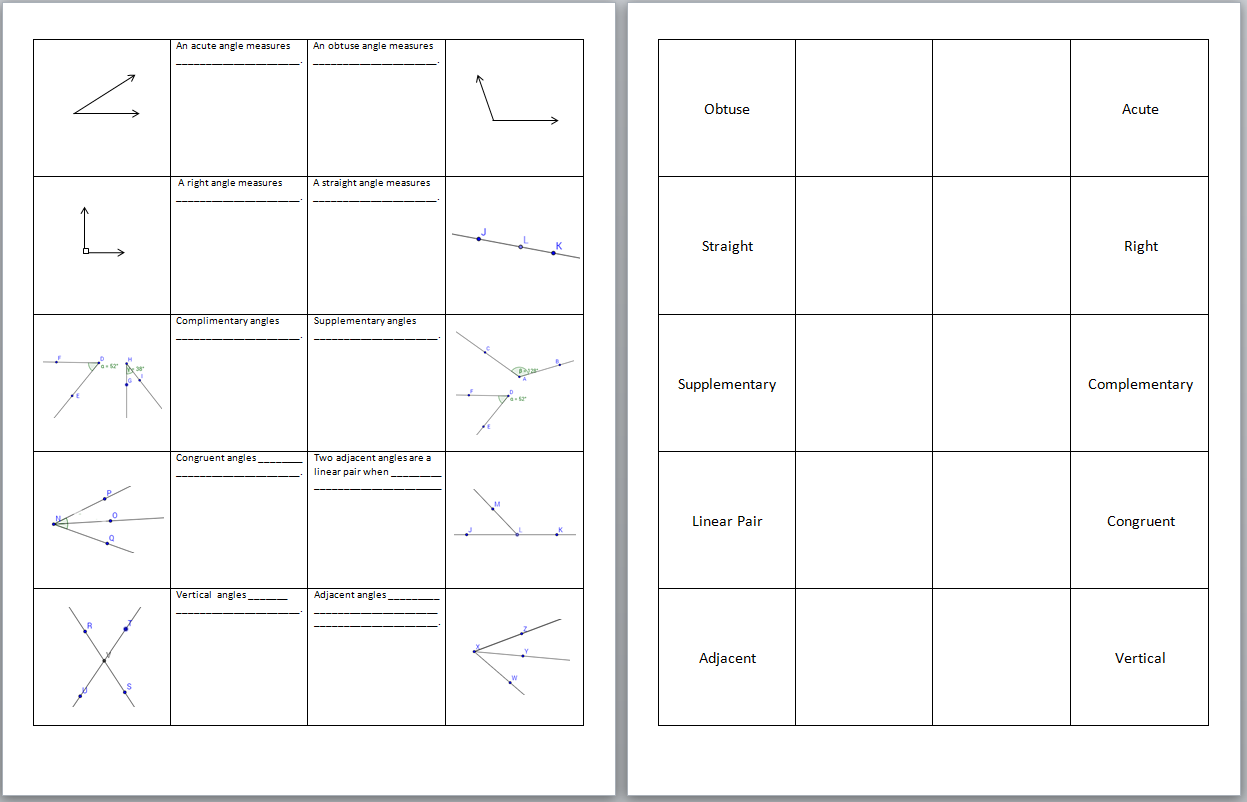
Sometimes the hardest part of Geometry is the foreign language in which it is delivered. Angles can be acute, obtuse, right, straight, complimentary, supplementary, adjacent, vertical, congruent, and can have common sides with one another or non-common sides. Add terms like opposite rays and make a distinction between congruence and having equal measures and you [...]

By | 2017-11-13T22:02:01+00:00 August 4th, 2015|Geometry|0 Comments

Could Nebraska Rely Exclusively on Wind Energy in Your Lifetime?

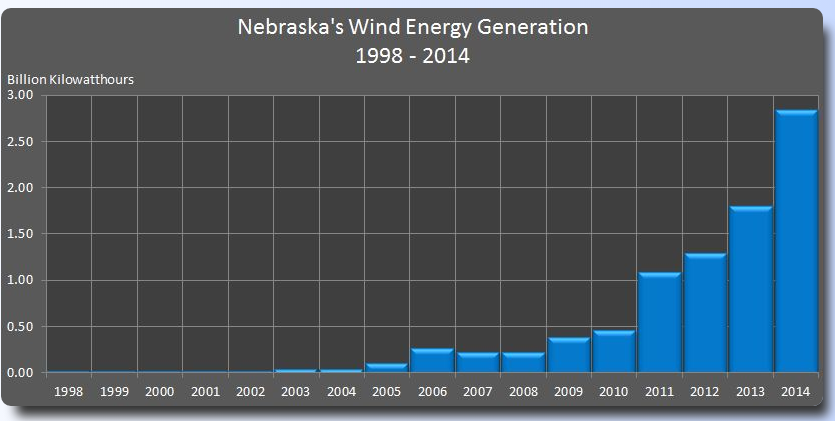
President Obama announced his carbon pollution standards for power plants on 8/03/2015. In it he outlines a 32% cut in carbon dioxide emissions by 2030. Currently, Nebraska gets about 72% of its electricity from coal. According to the American Wind Energy Association, Nebraska has the potential of meeting more than 118 times the state's current electrical [...]

By | 2017-11-13T22:02:01+00:00 August 3rd, 2015|Graphing Calculator, PreCalculus|0 Comments

Area in a Coordinate Plane

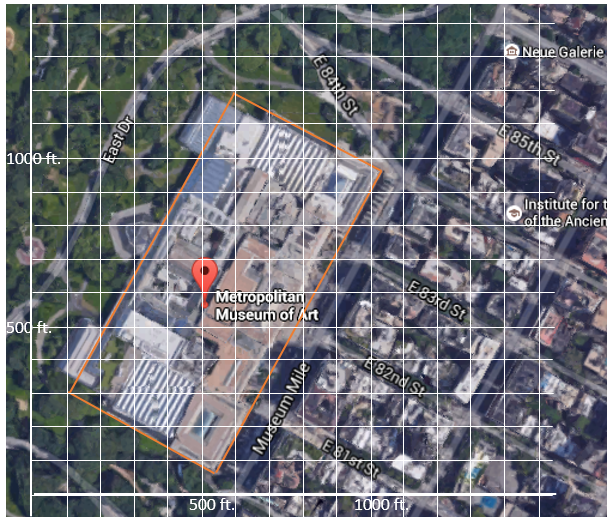
Google Maps gives you a way to measure distances on a map. If you right click on the map and choose Measure Distance, the first point you click becomes the starting point. When you click a second point, Google Maps provides a scale with the distance between the points  shown in a box.    This scale can [...]

By | 2017-11-13T22:02:01+00:00 July 24th, 2015|Uncategorized|0 Comments