
Two weeks ago I wrote a post called Equations from Data. In it, my pre-calculus students first were charged with finding a curve of best fit for global iPod sales data from 2006 to the present. Then they were asked to find an equation for the curve of best fit for global iPhone sales. The goal was to show them that their knowledge of various functions can help them predict sales of products much like a business analyst might.
I thought I had planned for everything. I had steps for entering data into a table and using sliders in Desmos. I had steps for doing the same in a spreadsheet in Geogebra. I also had the steps for finding the equation of best fit using a TI- graphing calculator. Thus if we had trouble with one piece of educational technology, we had an alternative or two.
1st class
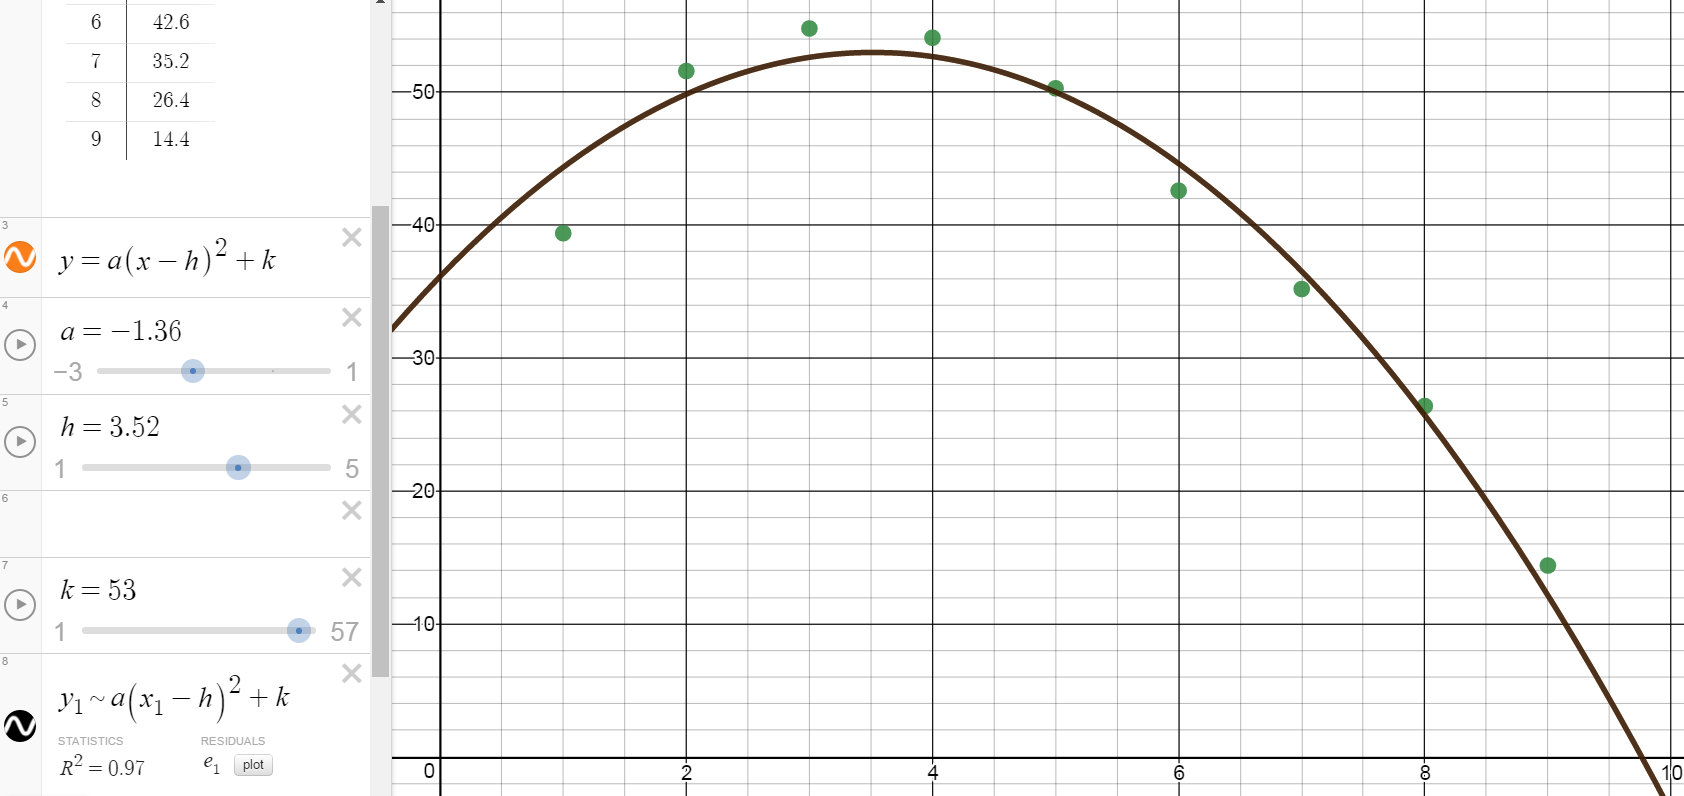
My 1st hour students, when given a choice, chose Desmos. They had had the most exposure to it in their Algebra II classes. The iPads we were using were older models and did not have the Desmos app installed so we went to Desmos.com. Everything was going smoothly – we had tables created, points plotted, sliders made so we could change a, h, and k to model the graph. The hiccup came when we tried to modify the slider for k to compensate for our data. On the iPads we were using (which weren’t updated to the latest version of iOS) we were not getting a keyboard to appear when we wanted to type in a higher max than the default.
I had tested the whole process using my (updated) iPad and had not had this issue. By this point we had invested a lot of time into this process, so I switched to demo mode for the sliders and we tweaked as a class until our R² value was as close to 1 as we could get it. Then we tried Geogebra.org with the second investigation involving iPhone sales. The on-line version lagged a lot so students were frustrated, but in good spirits. They asked as we were packing up, “Can we do this again tomorrow?” I took that as a good sign that they found the task interesting and didn’t want to give up. However, I knew that particular cart was booked and the freshmen were in the middle of MAP testing so technology was scarce. I also fear deviating too much from our pacing and having to cram a bunch in at the end of the semester.
My plan immediately followed that class so I entered a help desk ticket asking for the Desmos app to be added to our Self Service system so it would be available in the future. Then I used my planning time to install the Geogebra app on all the iPads since it was available in the Self Service system.
2nd class
My next pre-calculus class arrived (5th hour) and we got to work using the Geogebra app. I reasoned that perhaps it wouldn’t lag as much as the web version. I knew I could have my students pull out their graphing calculators and come up with an equation for each data set, but I really wanted them to try to find the equations first before having an app or calculator find it. Plus, many of my students don’t have a graphing calculator yet so the experience wouldn’t be as rich with two or more students looking at a tiny screen.
Alas, the lagging issues appeared with a vengeance – seemingly worse than they were using the web version of Geogebra. I think the age of the iPads was a big factor, but the fact that they weren’t updated could also have been the problem. This class was more frustrated than the first. I switched to demo mode and we walked through the process via my laptop/projector.
3rd class
I checked the Self Service app during passing period and the help desk was incredibly quick to install the Desmos app. Plan C was to have my next class use the Self Service app to download and install the stand alone Desmos app on their iPad. They were quickly able to complete the task and we got to work. There were no issues with missing keyboards when we attempted to change k’s max value and my students were able to predict when iPods would no longer be sold and the estimated global sales of iPhones for 2016. We wrote our prediction in the corner of our chalk board and asked the custodians to save it. We’ll compare our prediction to the actual iPhone sales once those numbers are released early next year.
Prediction: 278.84 million global iPhone sales. We’ll see how close we come.
Summary
You can dot all i’s, cross all t’s, and attempt to plan for every contingency and it can still fall apart. But when it works, it’s magical.

Leave A Comment