
There are countless articles about food and nutrition. When reading anything, it is important to consider the source, the expertise of the author, any biases or agendas, as well as whether the statistics are being manipulated to make a point. It is also important to learn how to use the data to form your own conclusions.
Take, for example, the amount of sugar the average American is reported to eat each day. The May 2013 NCHS Data Brief stated that American men on average get 335 calories from sugar which is equivalent to 83.75 g or about 21 teaspoons of sugar a day. The average American woman gets 239 calories a day from sugar. That is the same as 59.75 g of sugar or almost 15 teaspoons. According to the American Heart Association teenage boys get 362 calories in added sugars (30.1 teaspoons), girls eat 282 calories (17.6 teaspoons).
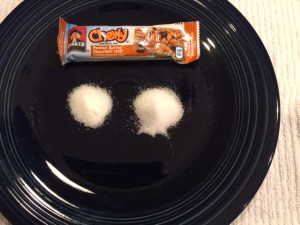
Wait a minute, you think. Someone else is consuming all that added sugar, not me. Let’s start with that granola bar you had as an afternoon snack. To determine how much sugar is in a packaged food, check the label. Every four grams of sugar is equal to one teaspoon.
Eating a popular variety of yogurt for breakfast is healthy, right? Some of the sugars in yogurt occur naturally in the form of lactose. The total sugars in the product below are equivalent to six and a half teaspoons.
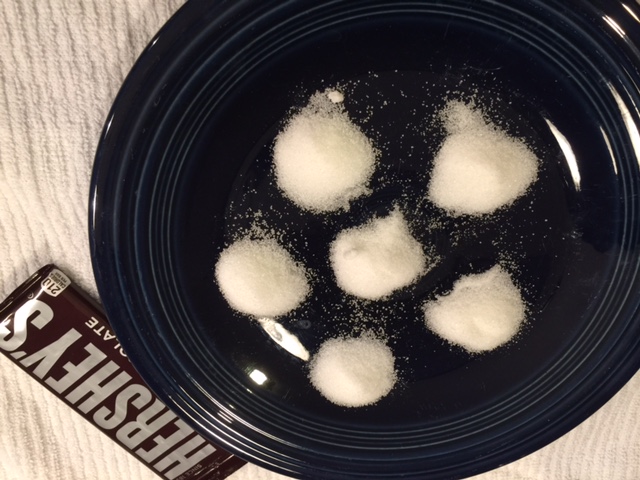
A full sized candy bar has less sugar than the yogurt above. It also has more fat and less calcium and vitamins so do not use this article as a justification to swap yogurt for candy.
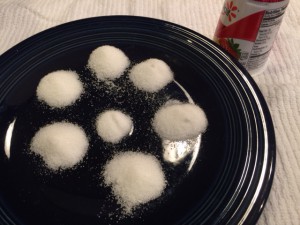
What about a soda? The 44 g of sugars are all added sugars and are equivalent to 11 teaspoons of sugar.

So how much added sugar should you consume to be in a healthy range? According to CBS News, the World Health Organization recently revised its recommendation from 10 percent of your daily caloric intake to 5 percent or 25 grams of sugar per day. (L. Te Morenga et al. Br. Med. J. 346, e7492; 2013;P. J. Moynihan and S. A. M. Kelly J. Dent. Res. 93, 8–18; 2014)
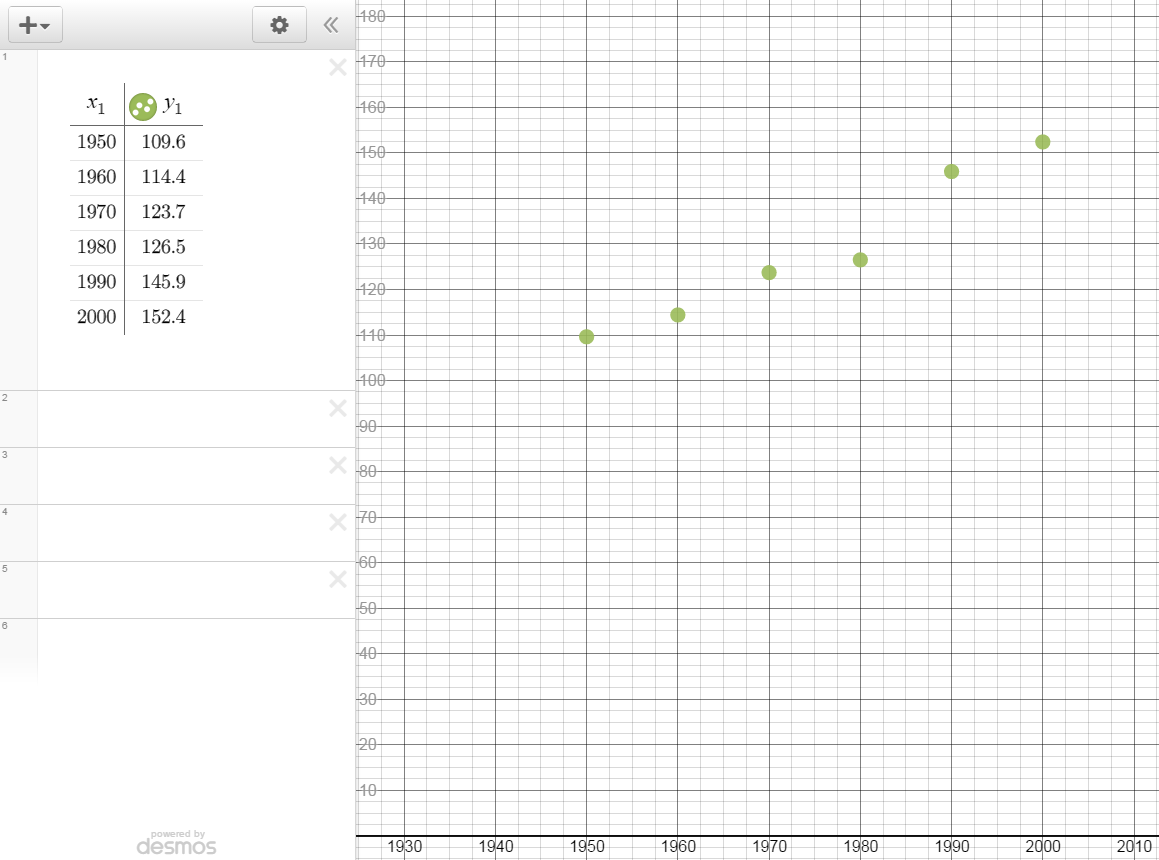
A Sweeter Tooth
According to the USDA, our taste for sweeteners has grown throughout recent decades.
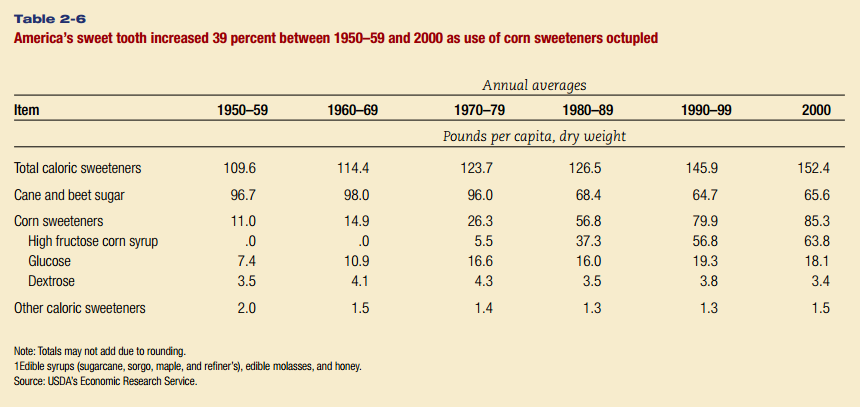
For a year-by-year comparison of more recent data see Table 49—U.S. total estimated deliveries of caloric sweeteners for domestic food and beverage use, by calendar year
Play with the data. Plot it on graph paper or by using an online graphing calculator. Find the slope between the points to see how much sugar consumption is growing per year. Put the data into Excel or some other spreadsheet software. Compare the graphs of overall sweetener consumption to cane and beet sugar consumption to high fructose corn syrup. Make predictions about what you have heard in the media recently regarding these topics. Do you think these trends will continue?
Your mathematical knowledge does not need to be limited to a page of problems from a text book. There is so much data out there just waiting to be explored.
Explore more: See Line of Best Fit.

Leave A Comment