
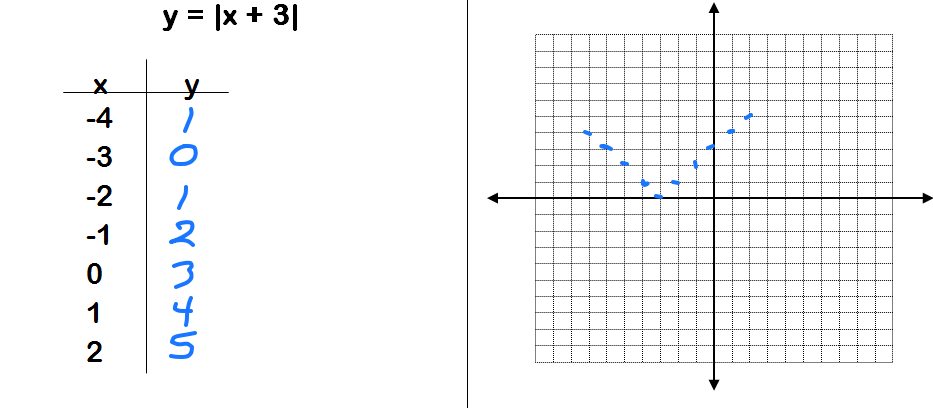
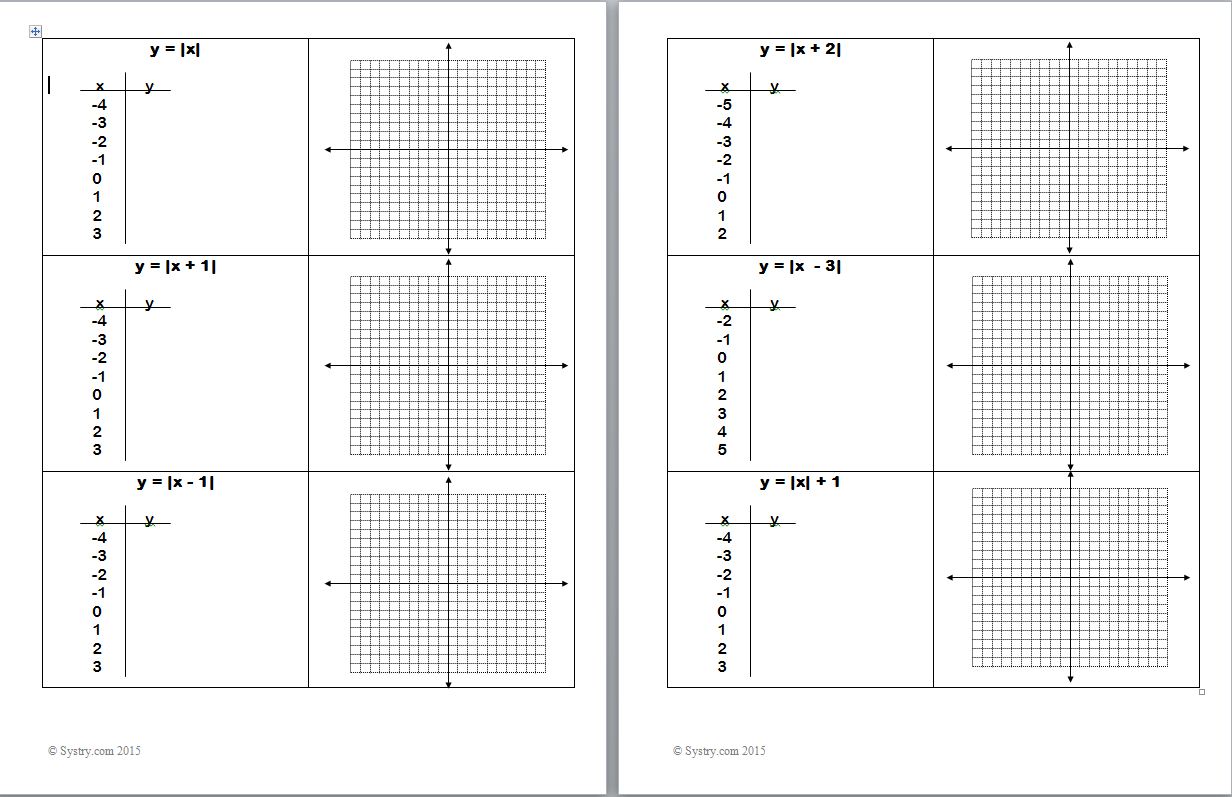
When graphing the absolute value function, create a t-chart and list values for x. Then plug those values into the equation to find y.
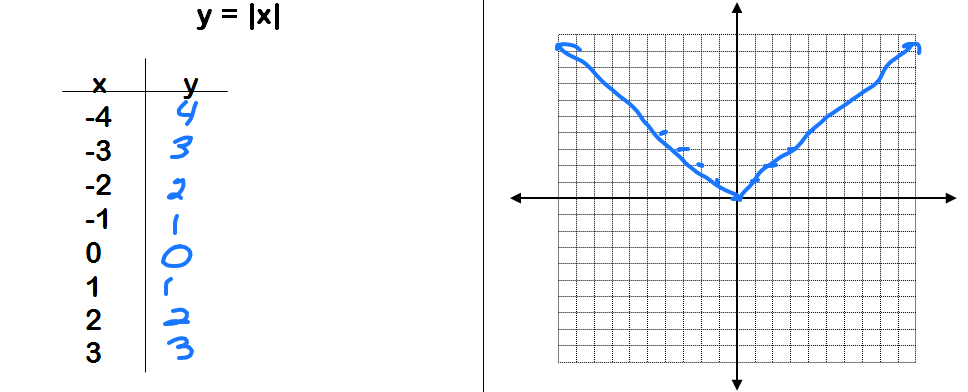
Be sure to treat the absolute value like a parenthesis and perform the order of operations using it as a grouping symbol. Anything within the absolute value is performed first.
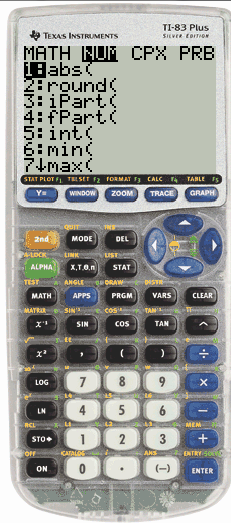
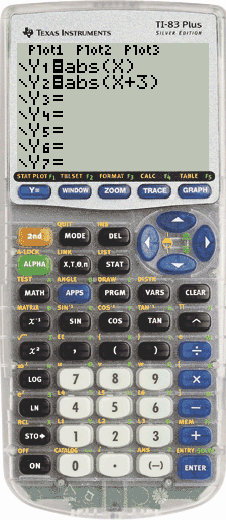
Once you have practiced graphing several absolute value equations and understand its behavior, you can check your work using a graphing calculator or an online graphing calculator like Desmos.
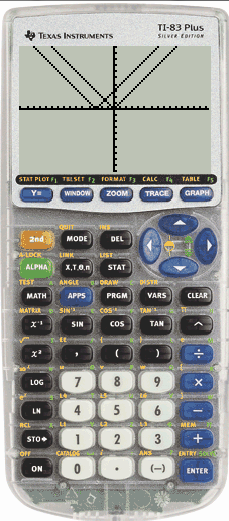
3:09 of the video shows how to graph absolute value equations using a TI-84+.
A Graph Absolute Value student handout is provided for download.

Leave A Comment