
Absolute Value
To understand how the absolute value can be applied to the real world, we’ll look at two topics:
- What is considered normal with regard to the temperature of the human body and
- Fuel economy of two vehicles: a Honda Odyssey and a Nissan Altima.
The absolute value of a number can be thought of as the value of the number without regard to its sign. For example |3| = 3 and |-5| = 5. When plotted on a number line, it’s the distance from zero.
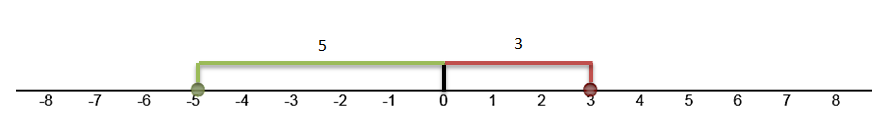
We use the absolute value when subtracting a positive number and a negative number. Subtract one number from the other and give the result the sign of the number that has the greater absolute value.
2 – 9 = -7 because the difference between 9 and 2 is 7 and the -9 has the larger absolute value making the result negative.
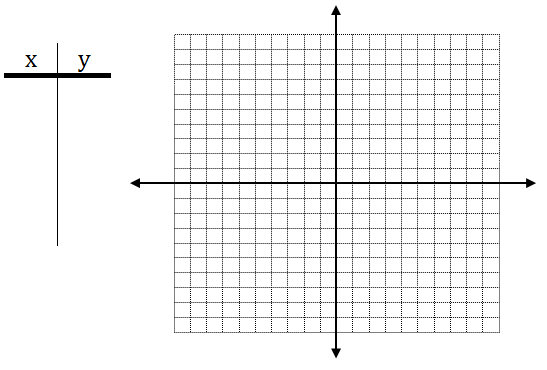
What would the graph of y = |x| look like?
What is Normal?

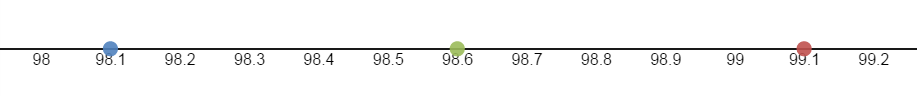
An absolute value function can be used to show how much a value deviates from the norm. The average internal body temperature of humans is 98.6° F. The temperature can vary by as much as .5° and still be considered normal. On a number line, the normal temperature range for a healthy human appears below.
As a function, the equation is y = |x – 98.6|.
The x-axis corresponds to the temperature of the person in question. What does the y-axis represent?
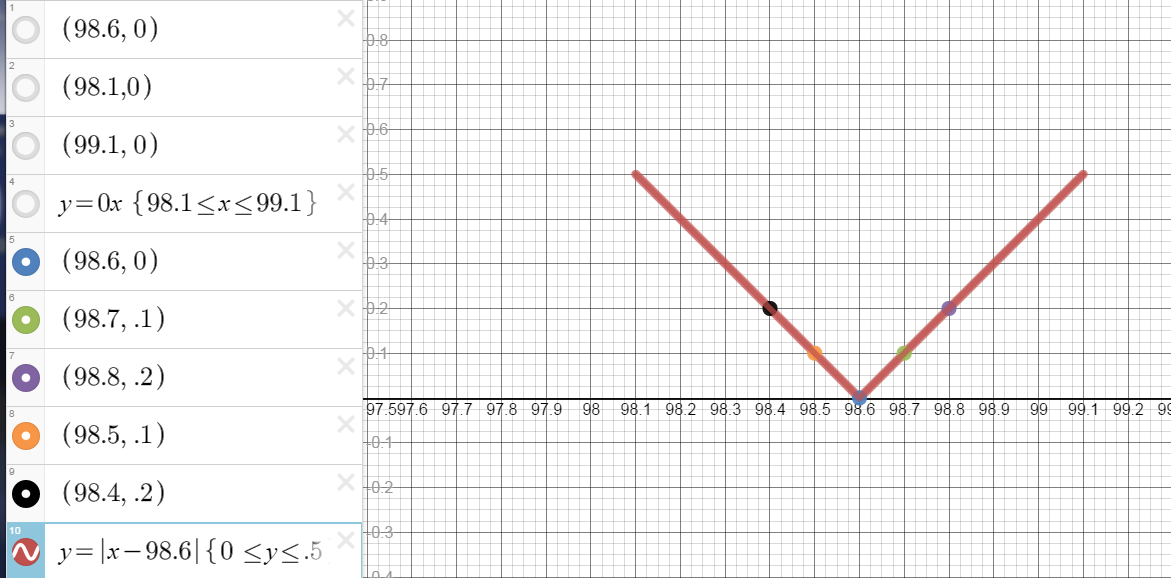
To graph the equation y = |x – 98.5| substitute various values in for x and plot the points.
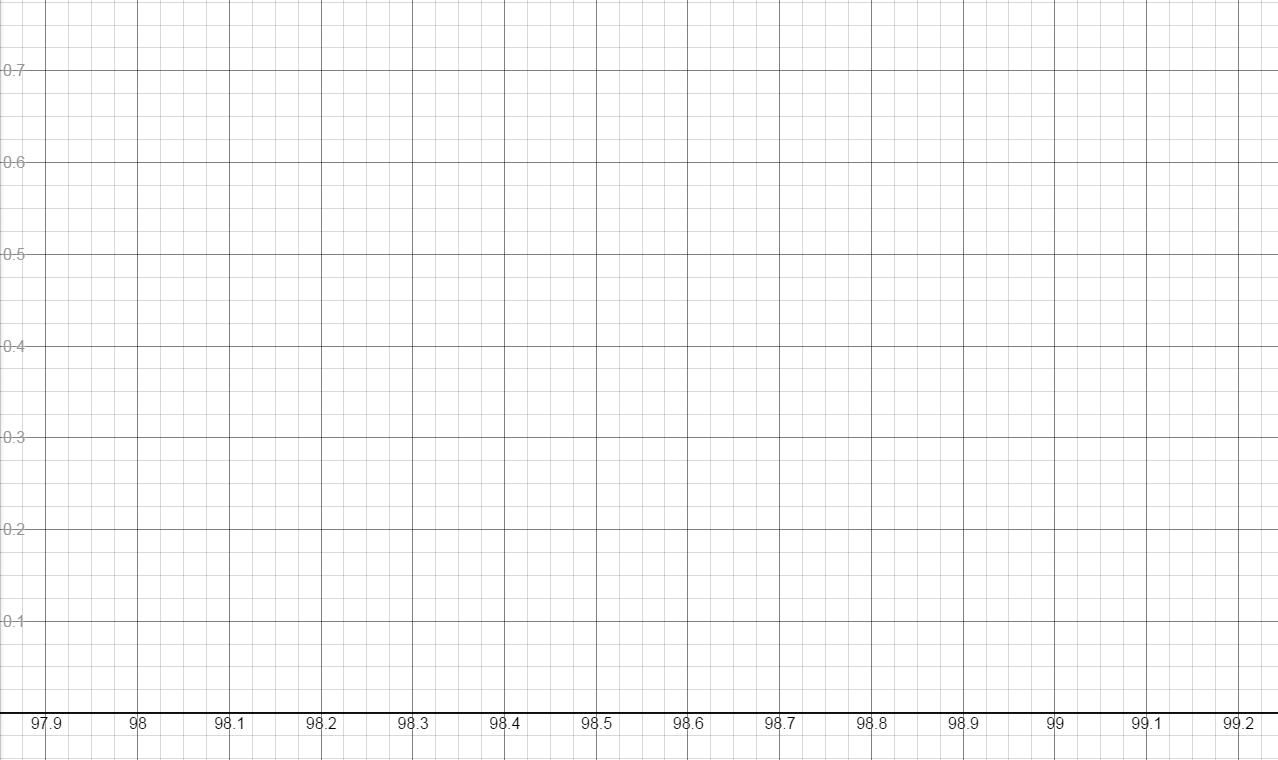
Your resulting graph should look like the following:
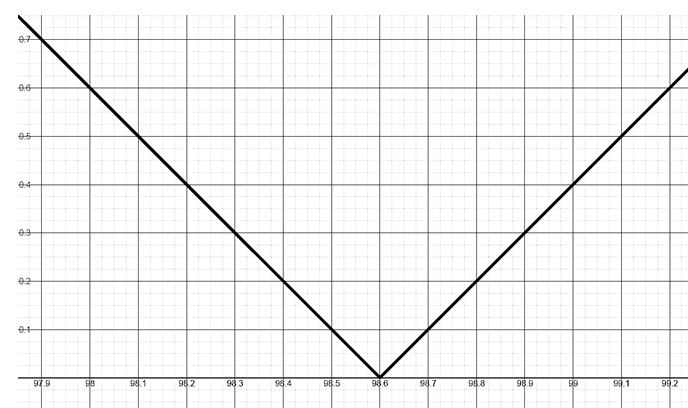
However, to represent a normal temperature, the range (or y values) of the graph must be limited to 0 ≤ y ≤ .5 or
Therefore, the final graph would be a “V” from the point (98.1, .5) down to (98.6, 0) and back up to (99.1, .5).
Gas Mileage
Minivans, due to their size and purpose, are not typically very fuel efficient vehicles.

The EPA’s estimates for fuel efficiency for this van are shown below.
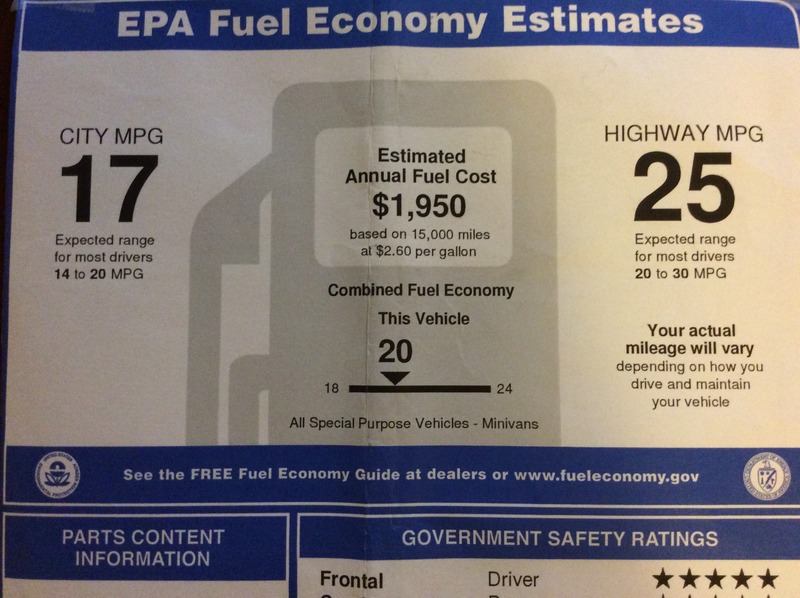
Based on what you now know about the absolute value function, can you write an equation that describes the van’s estimated city miles per gallon fuel efficiency?
What would the graph look like?
To be within the government’s estimated fuel efficiency range for city driving for this van, what would the range of the function be? (Note the small print below the 17 MPG rating showing expected variation in economy.)
Now write an equation for the estimated highway fuel efficiency. What would the range of the function be for highway driving? What would the graph look like?
On a recent outing, the van was filled with gas. Each time the tank is filled, Trip B is reset. Based on the images below, calculate the gas mileage for the previous tank of gas.
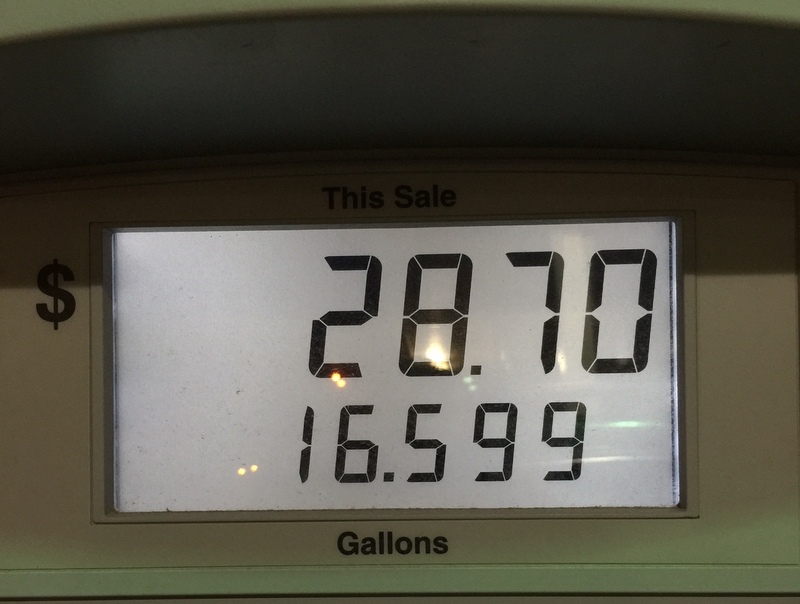
Was the MPG within the expected range?
Was the van driven primarily in the city or on the highway?
What was the cost of gas per gallon at the time it was filled?
Further Investigations
To learn more or extend your knowledge on these topics see:
EPA Investigation Prompts Carmaker to Correct Inflated Mileage Claims

These are fun / valuable examples I can use for my algebra classes – thanks!
Awesome Examples. Thanks for putting in the time.