Composite functions are a combination of two functions. The traditional math course introduces them like this:
Let f and g be functions with overlapping domains. Then for all x common to both domains:
- (f + g)(x) = f(x) + g(x)
- (f – g)(x) = f(x) – g(x)
- (fg)(x) = f(x) · g(x)
- (f/g)(x) = f(x) / g(x), if g(x) is not equal to zero.
Then two functions are given and students are asked to add them, subtract them, multiply them, and divide them. Then they are introduced to composite functions. It all seems academic. Little is done to describe when this might actually be used or applied.
Here is a real world scenario.
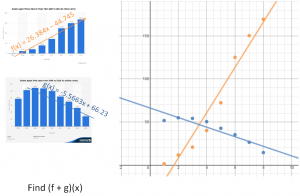
According to Statista.com, Apple’s iPhone fiscal sales are steadily climbing.
During the same time frame, iPod sales are steadily falling.

It is apparent that iPhone sales are cannibalizing iPod sales. Should Apple be worried?
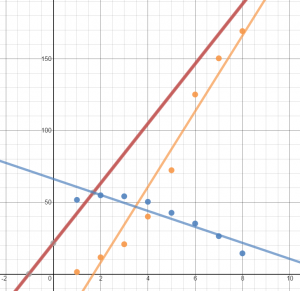
When the data is entered into the Desmos online calculator, a linear regression can be performed. Two equations can be found that model the data.
Again, should Apple be worried. Hopefully this brings a discussion about how graphs can skew perception based on scale.
Ask students to add the functions to get a combined units sold. Graphing that line as well helps build a case as to whether or not Apple should be worried about the iPhone cannibalizing iPod sales.
To see the data on Desmos’ site, click the image below.

Hopefully a real world example will help students see the relevance, spur discussions on when you may want to subtract functions or multiply or divide them, and give them insights into tasks financial analysts may perform in their daily work.


Leave A Comment