Graphing Absolute Value
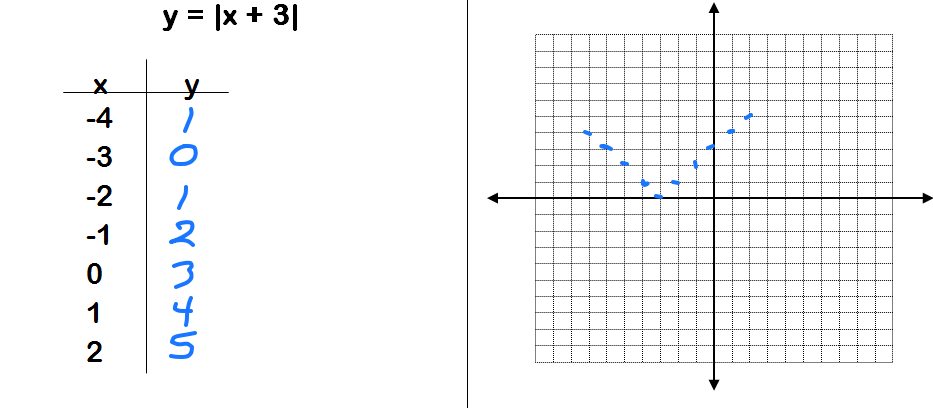
https://www.youtube.com/watch?v=LXhADp-KPg8 When graphing the absolute value function, create a t-chart and list values for x. Then plug those values into the equation to find y. Be sure to treat the absolute value like a parenthesis and perform the order of operations using it as a grouping symbol. Anything within the absolute value is performed first. Once [...]

