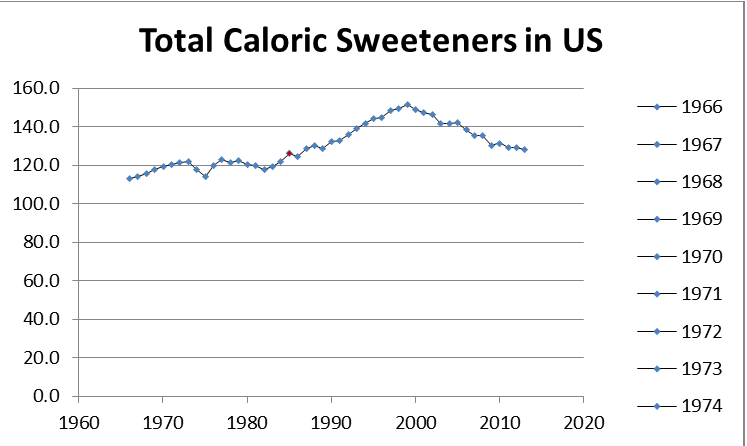
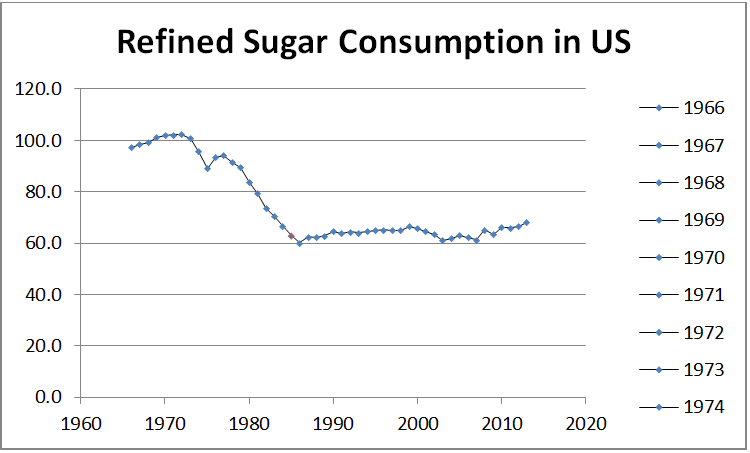
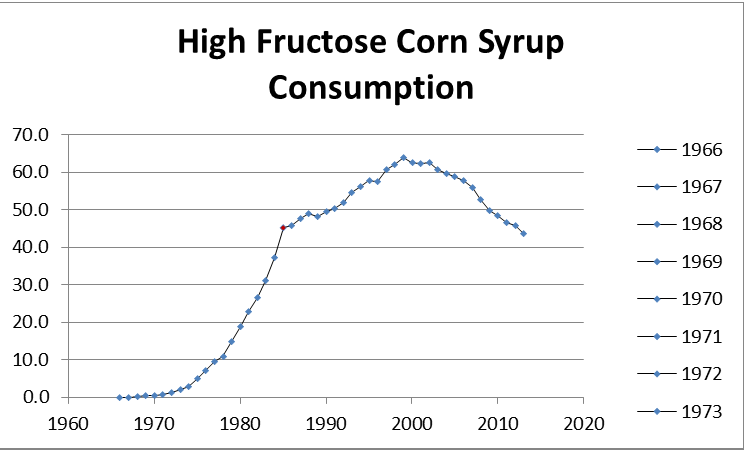
If sugar and added sweeteners are the culprits, we should be making some strides at curbing obesity based on the data plotted below.
Note the peak of total sweeteners and high fructose corn syrup in 1999 and the subsequent drop in consumption of both. Can you guess the significance of the red point in all three graphs?
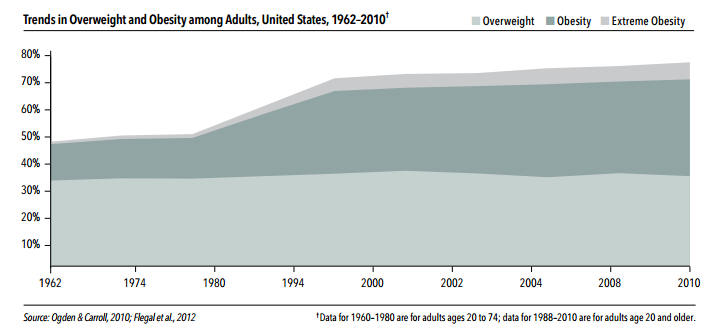
Based on the data graphed above from Table 49—U.S. total estimated deliveries of caloric sweeteners for domestic food and beverage use, by calendar year, one would think obesity in the US would be on the decline since 2000. The graphic below says otherwise.
If sweeteners aren’t the culprit, what is? The graph below shows where the average person’s calories come from. The increase in fats and oils is due to more companies reporting their production numbers and is not attributed to a sharp increase in consumption but a more accurate representation of where those numbers likely should have been over time.
Meat and flour and grain consumption have leveled off. While we are consuming on average 500 more calories per day than we did in 1970, what we eat may not be the only culprit.
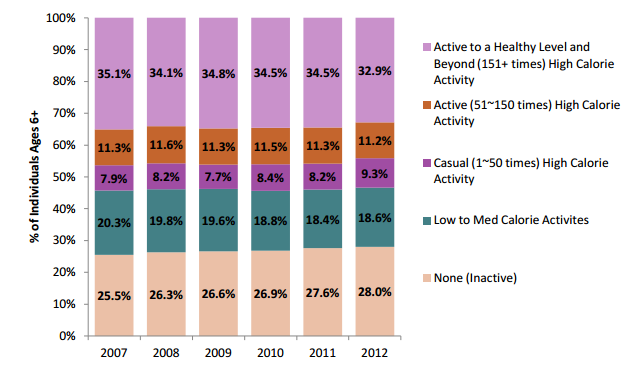
Based on the 2013 Physical Activity Council Report, roughly 33% of Americans are active to a healthy level.
The number of sedentary jobs has increased while the number of physically demanding jobs have decreased. We have not compensated for this by becoming more active in our leisure time.
What do you think? What is the greatest contributing factor to the obesity epidemic in the US? Is there one major contributor or are many factors to blame? What strategy would you take to fight the fight?



What’s with that incredible spike- around 2000- in “added fats, oils, and dairy fats”? What products were connected to that?
I’ve been looking at the rise in Type-2 diabetes and what kinds of consumption may correlate. What’s fascinating is the HFCS
consumption seemed to peak and slow dramatically after 2000. Perhaps there’s some corresponding dietary reason connecting
these two trends.
Anyhow, thanks for putting this data together. ^..^
According to the USDA’s website, “In 2000, the number of firms reporting vegetable oil production to the U.S. Census Bureau increased noticeably. As a result, estimates of the availability of salad & cooking oils and shortening spiked. ERS surmises that it is unlikely that this unusually large increase in the number of firms occurred in one year; it is more likely that the number increased incrementally over time. The spike suggests that the availability estimates in a few years before 2000 could have been somewhat underestimated.”
https://www.ers.usda.gov/data-products/food-availability-per-capita-data-system/food-availability-documentation/#fats
The consumption of HFCS began in the late 60s. The red dot on the graphs is 1984. At that time, sugar became the primary sweetener in Coke and Pepsi products because it was cheaper. Other food industries followed suit. http://www.nytimes.com/1984/11/07/business/coke-pepsi-to-use-more-corn-syrup.html