
In the real world, many lines don’t have nice numbers for their slope and y-intercept. Decimals and fractions are a commonplace. When we encounter these numbers, using a graphing calculator makes sense.
Calculator Set Up
- Make sure that your calculator has the Plots Off, Y= functions cleared, the MODE and FORMAT are set at “stage left”, and the lists are cleared.
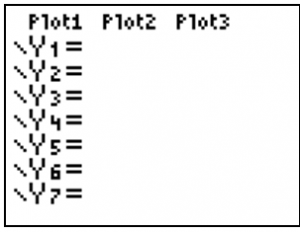
- Turning Plots Off – Press the Y= key. If your screen doesn’t look like the one at the right, arrow up to the Plots that are darkened and press ENTER.
- Clearing the Y= functions – Arrow to any Y= equation that may be entered and press the Clear button.
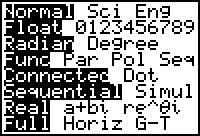
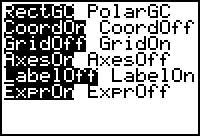
- Staging Left – Make sure all of the items in the left column of MODE and FORMAT (the 2nd of ZOOM) appear as they do below. Arrow to any that are not properly darkened and press the ENTER key.
Domain and Range of Data
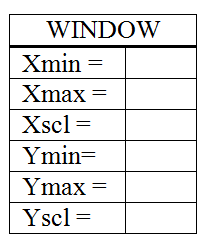
To quickly change to standard viewing window, choose ZOOM 6:Zstandard. Press the Window button and record what you see to the right.When you are graphing equations of lines, it’s important to be able to adjust the range so you can view both intercepts. The range tells the calculator which values to use as its domain and range (possible x- and y-values). Equations like y = -3x + 5, y = 2x – 6, and x – 3y = -2 can all be viewed in the standard viewing window (-10 to 10 by units of 1 for both x and y).
Graphing a Line
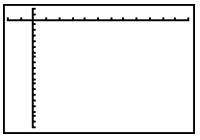
Press the Y= button. Type –3x + 5 next to the Y1 variable. (Be sure to use the (-) button as 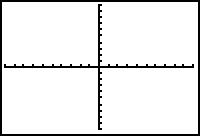 opposed to the minus sign. X can be typed quickly by using the X,T,q,n button.) Then press the GRAPH button. Sketch the graph you see below, being careful to plot the intercepts. You can find the x-intercept by pressing the TRACE button and then using the right or left arrow to follow the line. When the Y= value approaches 0 you can approximate the x-intercept.
x-intercept » _______, y-intercept = _______
Sketch the graphs of the following. List the x- and y- intercepts.
- y = 2x – 6
- x-intercept ________, y-intercept _________
- x – 3y = -2
x-intercept ________, y-intercept _________
- Graph y = 2x – 17 changing your window to match the values below. Sketch the graph and list the intercepts.
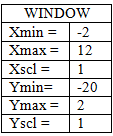
x-intercept ________,
y-intercept _________
Sketch the graph of the equations below. List the range of values you used.
- y = -x + 30

- y = 0.2x + 1.8
Use the graphing calculator to sketch the graph of the equation. Adjust your window so both intercepts are visible.
- y = 3.7x – 20
- y = -1.54x + 63.4
Use the graphing calculator to approximate the solution. (Hint: the intersection of two lines is the solution to their equations.)
- 9.1(2x – 12.1) = 15.6x + 24.7
- 1.4(2.1x – 5.8) = -0.2(x + 19.1
A printable version is available for classroom use. Graphing Lines on TI83+