
This activity is designed to help you become familiar with the graphing calculator. In it, you will learn to graph equations of lines, change the window, locate intercepts, and work with the table function of the calculator.
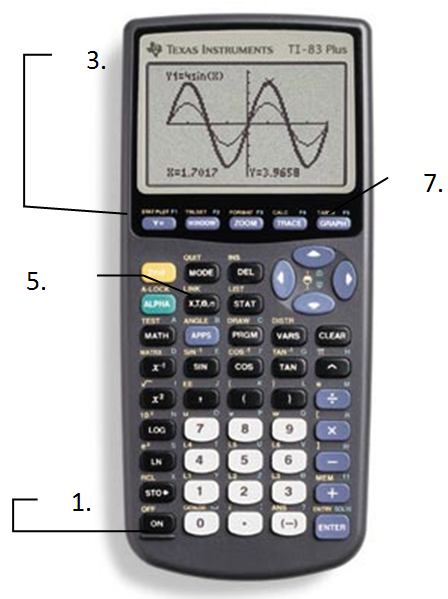
- Start by turning the calculator on.

- If you don’t have a blank screen, press the 2nd button, then QUIT (shift of MODE).
- Press the Y= button.
- If there is an equation stored in Y1 , press the CLEAR button. Repeat for Y2 and any other values that have an equation stored.
- With your cursor in the Y1 line, type 2
 +3 then Enter. You now have the equation y = 2x + 3 entered into the computer.
 - Press the ZOOM key. Choose option 6 for ZStandard. This gives you a coordinate plane with –10 to 10 as its x and y values.
- Press the 2nd button, then TABLE (shift of GRAPH) to see a table of values for your equation.
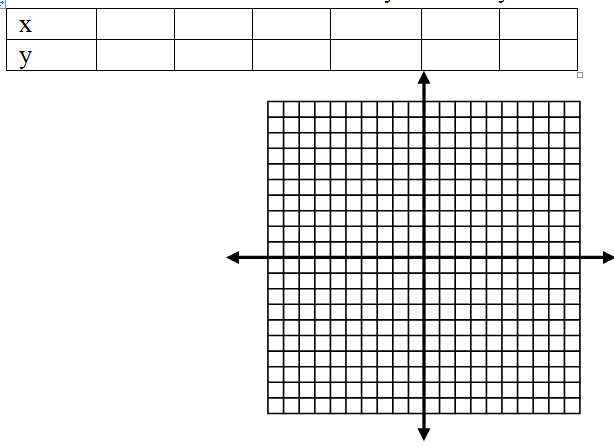
- Draw the table with 6 values for x and y below.
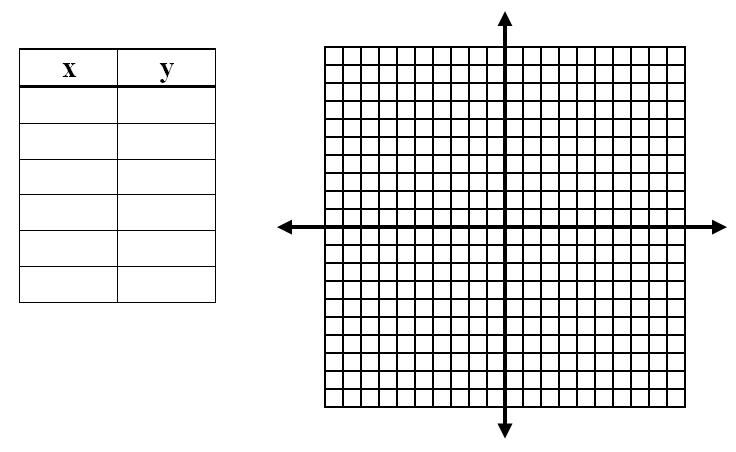
- Press the GRAPH button to see the line again and sketch what you see on the calculator on the coordinate plane below.
- Repeat the process with the equation 4x + y = -5.
- Repeat the process with the equation .
- Did you get a line? ______________ What do you think happened to it?
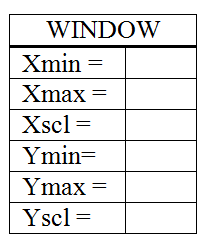
- Press the WINDOW key. Change the values to reflect those in the table at the right.
- Press the GRAPH button. Sketch the equation below. Be sure to change your scale on your graph paper.
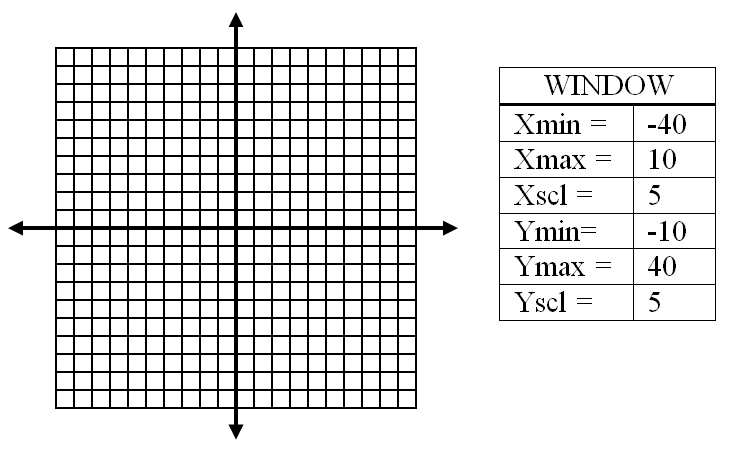
- Determine which values are needed to display the x- and y- intercepts of the graph of y = 5x + 60
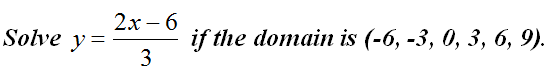
- Type the equation y=(2x – 6)/3 in Y1. Press 2nd then TBLSET (shift of WINDOW). Change TblStart = to -6 and ΔTBl = to 3. Press 2nd then TABLE to view the values for x and y. Record your table below.
- Sketch the graph above.
- Why did 2x -6 have to be in parenthesis in number 16?
- Why did we choose ΔTBl = to be equal to 3?
For a printable version of this activity see Graphing Linear Equations with TI83+.