
What Has Changed?
In Ebola 2014, we looked at data from the CDC regarding Ebola cases and deaths. The data was plotted in an Excel spreadsheet and on a TI-83+ graphing calculator to determine the curve of best fit. At that time the function that described the data was an exponential growth model.
Over time, more clinics were mobilized, better burial practices were enforced and the graphs of the number of cases and deaths have changed.
To work with the more recent data, download Reported Ebola Cases and Deaths or download the csv file from the CDC’s website.
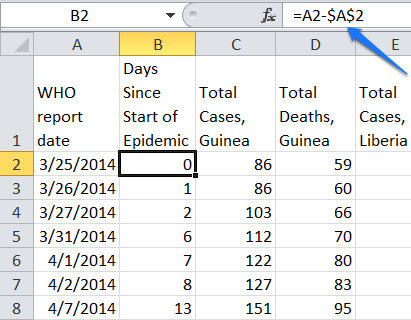
Right click on the B column to insert a new column. Add the column heading and in cell B2 add the formula =A2-$A$2. Change the format to General. Fill the formula down.
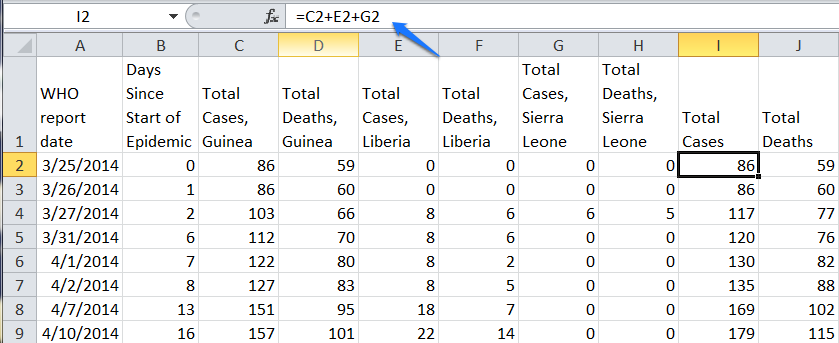
Add a column heading in cell I1 for Total Cases and one in cell J1 for Total Deaths. In cell I2 type =C2+E2+G2 to add the total cases for all countries and press Enter. Do the same for cell J2 with the formula =D2+F2+H2. Fill the formulas down.
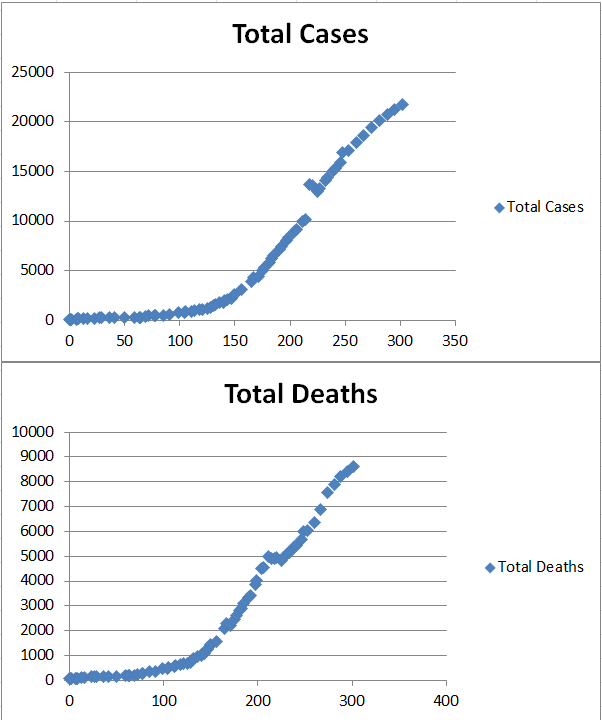
Highlight cells B1 down to B77, then press the Ctrl key and highlight I1 to I77 to select discontiguous columns. Go to the Insert menu and choose Scatter and choose the first scatter chart listed.

Repeat the process using cells B1 to B77 with J1 to J77 to plot the total deaths.
Obtaining a Curve of Best Fit
Because Excel can not calculate a logistics curve of best fit, if you want to generate an equation that fits the curve, you will need to enter the data into a TI graphing calculator.
Start by pressing Stat > Edit and pressing Enter to add the days since the outbreak began to the L1 column and Total Cases to the L2 column.

Next, press STAT > CALC and arrow down to Logistics then press Enter. Press 2nd 1 (L1) , 2nd 2 (L2) then press Enter.

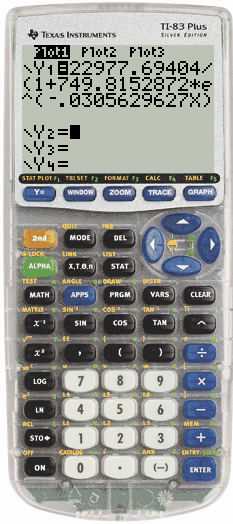
The equation will be generated and displayed on the screen.

Press the Y= button on the calculator. Type the equation into the Y1 line.
Set up the stat plot by pressing the 2nd Y=. Turn Plot 1 On and make the mark a small dot.

Press the Zoom button and choose 9. The data and curve will be displayed.

To better see when the curve is likely to flat line, see the logistics curve plotted on Desmos.

Extensions
Use a graphing calculator to predict when no more deaths from this outbreak will occur by finding it’s logistics equation. Repeat the process for the individual countries listed in the data set.
For an example of another logistics curve see Logistics Growth Curve – AIDS Infections