
You can use your graphing calculator to not only graph equations of lines, but also to generate a table of data.
- Make sure that your calculator has the Plots Off, Y= functions cleared, the MODE and FORMAT are set at “stage left”, and the lists are cleared.
- Press the Y= button. With your cursor in the Y1 line, type 2
 +3 then Enter. You should have the equation y = 2x + 3 entered into the calculator.
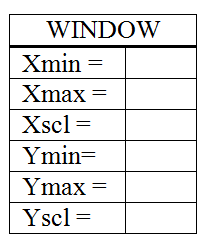
 - Press the ZOOM key. Choose option 6 for ZStandard. This gives you a coordinate plane with –10 to 10 as its x and y values.
- Press the 2nd button, then TABLE (shift of GRAPH) to see a table of values for your equation.
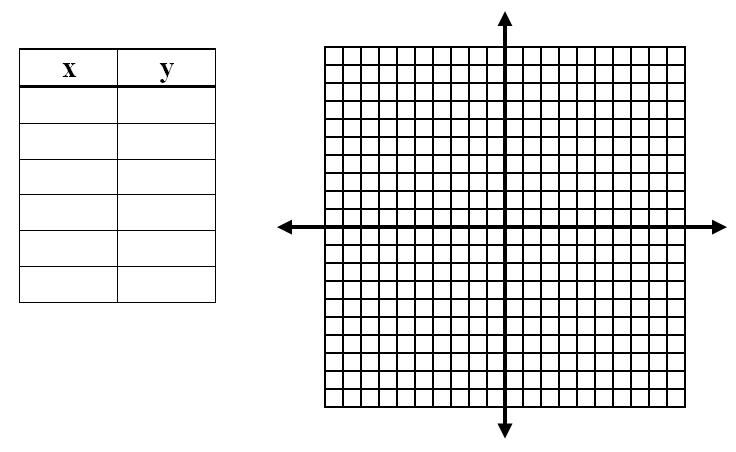
- Fill out the table below with 6 values for x and y.
- Press the GRAPH button to see the line again and sketch what you see on the calculator on the coordinate plane.
- Repeat the process with the equation 4x + y = -5.
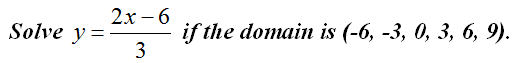
- Type the equation y=(2x – 6)/3 in Y1. Press 2nd then TBLSET (shift of WINDOW). Change TblStart = to -6 and ΔTBl = to 3. Press 2nd then TABLE to view the values for x and y. Record your table below.
- Why did 2x-6 have to be in parenthesis in number 8?
- Why did we choose ΔTBl = to be equal to 3?
A printable version of this activity is available for classroom use. Tables on TI Graphing Calculators