On the TI-84+ or TI-83+
Calculator Set Up
Make sure that your calculator has the Plots Off, Y= functions cleared, the MODE and FORMAT are set at “stage left”, and the lists are cleared.
- Turn the Plots Off – Press the Y= key. If your screen doesn’t look l
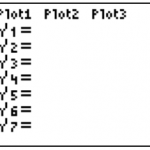 ike the one at the right, arrow up to the Plots that are darkened and press ENTER.
 - Clear the Y= functions. Arrow to any Y= equation that may be entered and press the Clear button.
- Staging Left – Make sure all of the items in the left column of MODE and FORMAT (the 2nd of ZOOM) appear as they do below. Arrow to any that are not properly darkened and press the
ENTER key.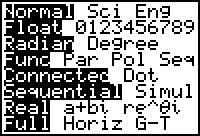
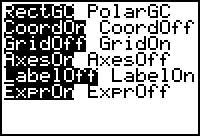
- Clear the Lists – Press the STAT menu. Choose option 4:ClrList. Type 2nd L1 (the 2nd of 1) then a comma (the key above the 7 key) then 2nd L2 (the 2nd of 2), then press ENTER.
Enter the Data
Data for this activity will be stored in L1 and L2. The x values will be entered into L1 with the corresponding y values in L2.
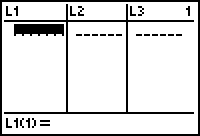
- Press the STAT menu and choose option 1:Edit…
- Type the first x value in the L1 table, then press ENTER, type the second value next, and so forth.
- Arrow over to the L2 table and enter the y values.
- Make sure there is an equal amount of data in both L1 and L2 so you don’t get a “dim mismatch” error.
The data for this activity are the following ordered pairs:
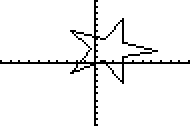
(3, 7) (3, 3.3) (6.5, 2) (3, 1) (3, -3.3) (.9, .3) (-2.5, -1.5) (-.5, 2.2) (-2.5, 5.2) (1, 4) (3, 7)
*Be sure to use the negative key (-) and not the minus key.
View your Data
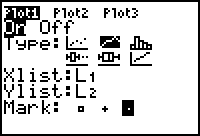
To view your data, you must set up a stat plot. Press 2nd STAT PLOT (2nd of Y=). Press ENTER to set up Stat plot 1. Set up your stat plot to look like the one below.
Then press the ZOOM key and choose option 9:ZoomStat.
It’s Your Turn
Create your own design by plotting points and connecting the dots on your calculator. Post your ordered pairs in the comments below.
Download the Plotting Pictures printable activity sheet.

